A variogram is a description of the spatial continuity of the data. The experimental variogram is a discrete function calculated using a measure of variability between pairs of points at various distances. The exact measure used depends on the variogram type selected (Deutsch & Journel 44-47).
The distances between pairs at which the variogram is calculated are called lags . For instance, lags may be calculated for samples that are 10 feet apart, then samples that are 20 feet apart, then 30 feet, etc. In this case the distance between lags is 10 feet. Since points may not be spaced exactly 10 or 20 feet apart, the lag settings include a lag tolerance value that is typically set to half of the distance between lags. For the previous example, that would mean that the first lag would include all pairs of points that are between 5 and 15 feet from each other.
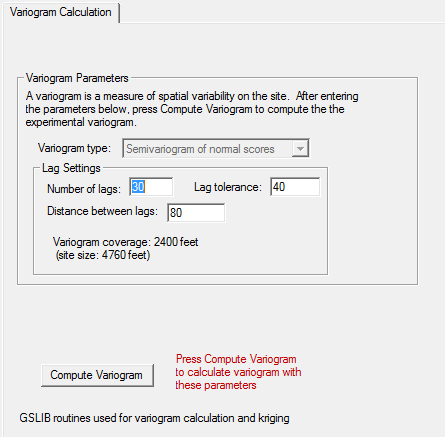
Variogram type:
Select the type of empirical variogram to calculate. The default and recommended first choice is Semivariogram . Other types can be better for skewed distributions or with the presence of extreme values. For example, the Semivariogram of logarithms uses logarithmic transform of the data, and therefore can be useful for log-normally distributed data. The Semivariogram of normal scores uses a normal score transform of the data (Deutsch and Journel 1998), which can also be helpful for highly skewed data.
The Add Sample Locations and Spatial Redundancy modules require the use of Semivariogram of normal scores.
Lag Settings:
Number of lags: Specifies how many lags of the variogram to calculate. This, together with the distance between lags, determines the maximum distance between pairs of points at which the variogram is calculated. This maximum distance is called the variogram coverage (number of lags times the distance between lags), and is displayed on the dialog. The variogram coverage should be less than the site size, and a good guideline is for the variogram coverage to be closer to ½ - ¾ of the site size.
Distance between lags: The intervals to calculate lags. A good distance between lags should be no smaller than the shortest distance between data points, and should be close to the average spacing of samples. The ideal lag spacing includes roughly the same number of pairs in each lag, and at least 30 pairs for each lag.
Lag tolerance: How much the distance between pairs can differ from the exact lag distance and still be included in the lag calculations. The default is ½ of the distance between lags, which ensures that all possible pairs are included.
Cameron, K, and P Hunter. 2002. Using Spatial Models and Kriging Techniques to Optimize Long-Term Ground-Water Monitoring Networks: A Case Study. Environmetrics 13:629-59.
Deutsch, C.V. and A.G. Journel. 1998. GSLIB Geostatistical Software Library and User's Guide, 2nd Edition, Applied Geostatistics Series, Oxford University Press, Inc. New York, NY.
Gilbert, RO. 1987. Statistical Methods for Environmental Pollution Monitoring. Van Nostrand Reinhold, New York.
Isaaks, EH, and RM Srivastava. 1989. An Introduction to Applied Geostatistics. Oxford University Press, New York.
Webster, R, and MA Oliver. 1993. How Large a Sample Is Needed to Estimate the Regional Variogram Adequately? . Geostatistics Troia '92 , ed. A Soares, Vol 1, pp. 155-66. Kluwer Academic Publishers, Dordrecht.