The Add Sample Locations module in VSP is based on a geostatistical analysis of existing data. The algorithm is based on the Reference Uncertainty Index (RUI) with respect to a concentration threshold of interest. The RUI equation is:
\begin{equation} RUI(u_{i}) = { IQR(u_{i}) \over |C_{med}(u_{i}) - C_{t}| + 1} \end{equation}
where:
\( RUI(u_{i}) \) |
is the reference uncertainty index at location \( u_{i} \) |
\( IQR(u_{i}) \) |
is the interquartile range (75th percentile - 25th percentile) at location \( u_{i} \) |
\( C_{med}(u_{i}) \) |
is the median concentration at location \( u_{i} \) |
\( C_{t} \) |
is the concentration threshold of interest |
The RUI is calculated for each location (each kriged cell) on the site. The RUI values are sorted from highest to lowest. VSP selects the location with the highest RUI and adds it to the list of new sample locations. The location with the next highest RUI is selected as the next new sample location candidate. The distance to all previous new sample locations is checked. If it is closer than the user-specified minimum distance, then the candidate location is discarded and the location with the next highest RUI is considered. If the distance is greater than the user-specified minimum distance, the location is added to the list of new sample locations. Processing stops once the user-specified number of new sample locations is reached..
The analysis is performed using a normal score transform of the data. Transformation of contamination data is often needed because of their tendency to be highly skewed (Gilbert 1987). The normal score is widely used in geostatistics because of its ability to transform data with any distribution into a variable with a perfectly normal (i.e., Gaussian) distribution (Deutsch and Journel 1998). The normal score transform is also used in the Probability and Uncertainty Mapping module in VSP.
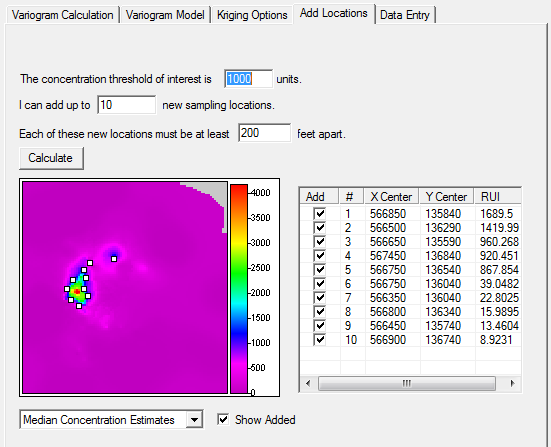
The Add Locations tab allows you to set three parameters
| Concentration Threshold: | New sampling locations will be added to reduce the overall uncertainty of locations on the map that are near this concentration. |
| Maximum Number: | This is the maximum number of new locations that will be added to the site map. |
| Minimum Spacing: | Minimum spacing between new locations. This prevents the new locations from being clumped together. |
After setting these parameters, click on the Calculate button to start the analysis.
Once the process is complete, you will see the proposed locations on the small map on the Add Locations tab.
The selector allows you to view a map of the Median Concentration Estimates or the Reference Uncertainty Index values.
You can examine the location of each of the proposed samples by checking the Show Added box and then checking / unchecking the Add box of the individual locations in the list.
Press the Apply button to save the parameters and new sampling locations to the project file.
Cameron, K, and P Hunter. 2002. Using Spatial Models and Kriging Techniques to Optimize Long-Term Ground-Water Monitoring Networks: A Case Study. Environmetrics 13:629-59.
Deutsch, C.V. and A.G. Journel. 1998. GSLIB Geostatistical Software Library and User's Guide, 2nd Edition, Applied Geostatistics Series, Oxford University Press, Inc. New York, NY.
Gilbert, RO. 1987. Statistical Methods for Environmental Pollution Monitoring. Van Nostrand Reinhold, New York.
Isaaks, EH, and RM Srivastava. 1989. An Introduction to Applied Geostatistics. Oxford University Press, New York.
Webster, R, and MA Oliver. 1993. How Large a Sample Is Needed to Estimate the Regional Variogram Adequately? . Geostatistics Troia '92 , ed. A Soares, Vol 1, pp. 155-66. Kluwer Academic Publishers, Dordrecht.