(Compliance Sampling to Assess the Success of Remedial Actions at UXO Sites)
Soil at some large military bases in the United States is known to contain unexploded ordnance (UXO). Confirmation surveys using geophysical detectors and the digging of anomalies are often conducted after UXO cleanup operations to provide confidence that the UXO removal effort has achieved cleanup goals. Accept on zero attribute compliance sampling (AOZ-ACS) (Squeglia, 1994; Bowen and Bennett, 1988) is a statistical approach for establishing confidence in the cleanup effort.
Suppose a UXO cleanup operation has been conducted in a defined area of land (a lot). If the military base contains more than one lot then a separate decision on the success of the UXO cleanup effort can be made for each lot.
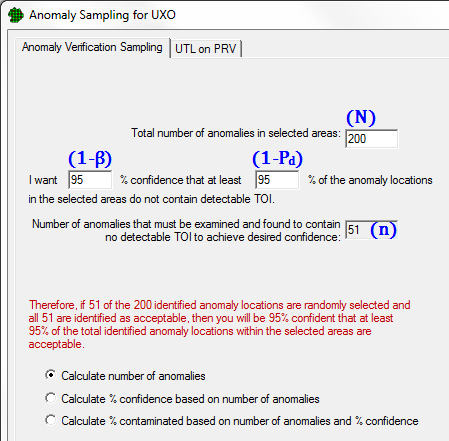
For a given lot, suppose a confirmation geophysical survey is conducted over the entire lot and \( N\) anomaly locations are identified. This AOZ-ACS module in VSP can be used to determine the number of anomaly locations, \(n\), that should be evaluated to establish \( Y \%\) confidence that at least \(X \%\) of the anomaly locations in the lot do not contain targets of interest (TOI), where \( N, Y\) and \(X\) are inputs specified by the VSP user (targets of interest are defined as the items that should have been removed during the initial remediation). Once \(n\) is determined, the \(n\) anomaly locations are selected from the \(N\) anomaly locations using simple random sampling. If none of the \(n\) anomaly locations contain TOI then it can be stated that there is \(Y \% \) confidence that at least \( X \% \) of the \(N\) anomaly locations in the lot do not contain TOI. If one or more of the \(n\) anomaly locations are found to contain TOI, then the lot is rejected, which means that the required \(Y \%\) confidence is not achieved. In that case, some sort of action is usually required, such as surveying additional anomaly locations and conducting further remediation as necessary to achieve the \(Y\) and \(X\) specifications.
The following assumptions are needed to assure the validity of AOZ-ACS and the confidence statement:
\( N \) anomalies have been detected in the lot by geophysical detectors.
The site owners and regulators have agreed on the value of the two input parameters (\(Y\) and \(X\)) of ACS. That is, they have agreed on the level of confidence required that at least \(X \% \) of the \( N \) detected anomalies are not TOI.
Simple random sampling is used to select the \(n\) anomalies that will be evaluated.
The detected anomalies cannot be inappropriately classified as TOI. That is, no non-TOI objects will be inappropriately classified as TOI.
\( N \) |
is the total number of detected anomalies in the lot. |
\( n \) |
is the number of anomalies that are selected from the \(N\) detected anomalies using simple random sampling that will be evaluated whether they are TOI or not. |
\( Pd\) |
is the maximum fraction of the \(N\) anomalies that can be TOI without the lot being rejected. \(Pd\) is typically a small fraction, e.g., 0.01 (1 percent). |
\(1- Pd\) |
is the minimum acceptable fraction of the \(N\) anomalies that are not TOI. |
\( H_0 \) |
is the Null Hypothesis, which is believed and assumed to be true prior to evaluating any of the \(n\) anomalies. The Null Hypothesis used with ACS is \( H_0 \) : The fraction of the \( N \) detected anomalies that are TOI is 0 (note that \(\alpha\), the probability of a Type I error, is 0). |
\( H_a\) |
is the Alternative Hypothesis, which is accepted as being true if the null hypothesis is rejected. The Alternative Hypothesis used with ACS is \(H_a\): The fraction of the \(H_a\) detected anomalies that are TOI is greater than \( Pd\). |
\( \beta\) |
is the acceptable Type II decision error rate. That is, \( \beta\) is the probability that can be tolerated of falsely accepting the Null Hypothesis based on the \(n\) identified anomaly locations. |
\(1- \beta\) |
is the required probability of correctly accepting the Null Hypothesis, i.e., the required probability of correctly concluding that the fraction of the \( N\) anomaly locations that are defective is less than or equal to \(Pd\). |
Using the above notation, the statement, \(Y \%\) confident that at least \(X \%\) of the \(N\) identified anomalies are not TOI can be restated as \( 100(1 - \beta ) \%\) confident that at least \( 100(1 - Pd) \%\) of the \(N\) identified anomalies are not TOI.
The VSP user is asked to specify the values of \(N\), \( 100(1 - \beta )\) and \(100(1 - Pd) \). Then VSP uses \( N, Pd \) and \( \beta\) in the following equation to compute \(n\):
\begin{equation} \large n \cong 0.5 \left( 1 - \beta^{ \frac{1}{N \times Pd}} \right)( 2N - N \times d + 1) \end{equation}
This equation is from Bowen and Bennett (1988, page 887, Equation 17.8). It was originally derived by Jaech (1973, page 327). Equation (1) gives the same values of \(n\) as obtained using the table look-up method described in Schilling (1982).
Example 1: If \(N\) = 200 detected anomalies in the lot, \(\beta\) = 0.05 and \(Pd\) = 0.01, that is, if we require 95% confidence that at least 99% of the \(N\) detected anomalies in the lot are not TOI, then
$$ \large n \cong 0.5 \left( 1 - 0.05^{ \frac{1}{200 \times 0.01}} \right)(2 \times 200 - 200 \times 0.01 + 1) = 154.8904 $$
Hence, 155 anomalies should be selected using simple random sampling and evaluated for TOI.
Example 2: If \(N\) = 200, \(\beta\) = 0.01 and \(Pd\) = 0.01, that is, if we require 99% confidence that at least 99% of the \(N\) detected anomalies in the lot do not contain TOI, then
$$ \large n \cong \left(1- 0.01^{ \frac{1}{200 \times 0.01}} \right)(2 \times 200 - 200 \times 0.01 + 1) = 179.55 $$
Hence, 180 anomalies should be selected using simple random sampling and evaluated for TOI.
Bowen, M.W. and C.A. Bennett. 1988. Statistical Methods for Nuclear Material Management, NUREG/CR-4604, U.S. Nuclear Regulatory Commission, Washington, DC.
Jaech, J.L., 1973. Statistical Methods in Nuclear Material Control, TID-26298, NTIS, Springfield, Virginia.
Schilling, E.G. 1982. Acceptance Sampling in Quality Control, Marcel Dekker, Inc, New York.
Squeglia, N.L., 1994, Zero Acceptance Number Sampling Plans. ASQ Quality Press, Milwaukee, WI.
Total number of anomalies in selected areas