The objective of this design is to delineate regions of high concentration levels, or "hot spots", while also reducing the number of laboratory analyses required and improving the estimates of the mean concentration through the use of multiple increment sampling.
Generally, discrete samples are gathered from within a study area, analyzed by a laboratory and the results are used in a site-specific statistical analysis. Because of the heterogeneities that exist in soil samples within study areas, a large amount of variability and skewness may be present in the sample population. This necessitates collecting a large number of samples to obtain reliable inference on the mean contaminant concentration and to understand the spatial patterns for future remediation. Multiple increment, or composite, sampling is a commonly applied method for gathering multiple discrete samples and physically combining them, such that each combination of discrete samples requires a single laboratory analysis.
While multiple increment sampling can reduce cost and improve mean estimates, other implementations do not readily facilitate the characterization of spatial patterns or the detection of elevated constituent regions within study areas. This sampling design provides efficient estimation and inference for the mean contaminant concentration over the entire spatial area and enables the identification of high contaminant regions within the area of interest. VSP will calculate the number of incremental samples that must be obtained under a design criteria to control false positive and false negative (Type I and II) decision errors.
Term |
Definition |
Decision Unit (DU) |
The sample area; the portion of the site to which inference is being made. Currently in VSP the DU must be rectangular, and only a single DU at a time is supported. |
Increment |
A discrete sample that is gathered from the DU. An increment is combined with other increments to form a multiple-increment sample. |
Multiple-Increment (MI) Sample |
A sample formed by mixing/blending a group of increments into one larger sample. Also referred to as a composite sample, multi-increment sample, or incremental sample. |
Background Mean |
The average contaminant concentration in areas within the decision unit that are not affected by site operations or use. |
The process of combining increments into MI samples depends on the sampling medium. Multi-Increment Sampling (MIS), or Incremental sampling (ISM), (US Army Corps of Engineers, 2009; Jenkins, et al., 2005) are approaches that are commonly used within the environmental soil sampling sciences. VSP relies on the assumption that the increments are combined into the MI sample with perfect blending. The mathematical interpretation of perfect blending is that the constituent concentration in the analyzed MI sample can be considered the arithmetic mean of the measured constituent concentration from each increment.
For this design VSP places increments in such a way that they can be combined into MI samples but still used to spatially locate areas of high contamination.
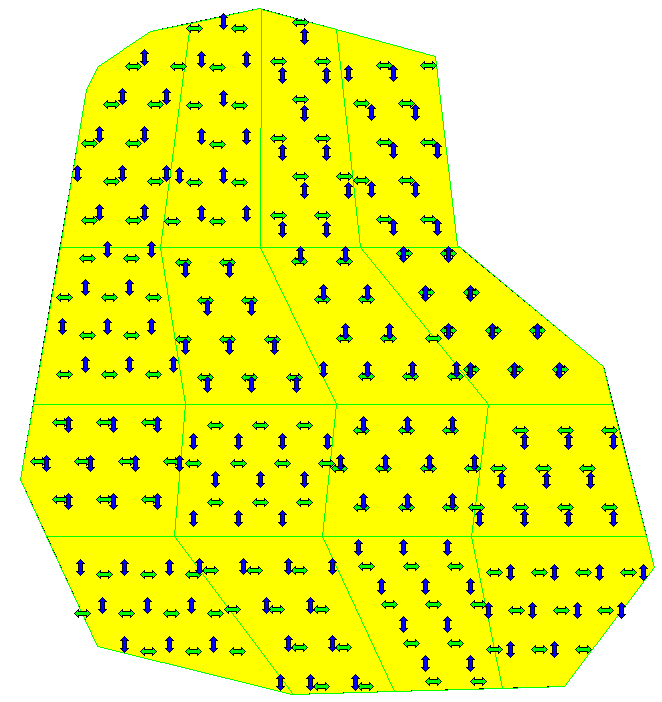
To place the increment samples, VSP will attempt to divide the sample area into r x r equally sized sub-areas, where r is the number of rows and columns. The site division algorithm may fail for complex site shapes. The grid consists of either square or rectangular grid cells and the centers of each cell represent increment sample locations. Figure 1 below illustrates an example of a site divided into 16 MI samples, with 10 increments placed within for both the row and the column increment.
Figure 1: An example increment placement with 4 rows, 4 columns and 10 increments per MI sample.
The increment locations marked with green horizontal arrows should be combined with all the other in that row, and the blue vertical arrow increments should be combined with the others in that column. Figure 2 shows an example of how increments would be combined in this case.
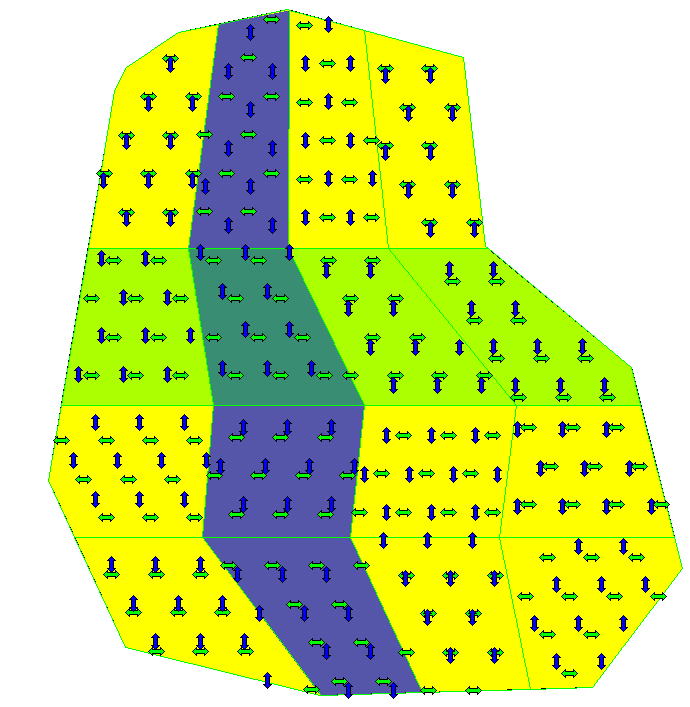
Figure 2: The blue vertical arrow increments are combined to form the MI sample for Column 2, and the green horizontal arrow increments are combined to form the MI sample for Row 3.
Symbol |
Definition |
i |
The number of increments placed in each "cell" MI Sample. Specified on the increment placement and ordering tab. |
n |
The number of "cell" MI samples (composed of i increments each) contained in each row and column multiple-increment sample. Equal to the number of rows r and the number of columns. c (n = r = c) |
\(\alpha\) |
The desired maximum probability of identifying an area as containing elevated levels of contamination if no elevated areas truly exist (type 1 error rate). |
\(\pi\) |
The power, or the desired probability of detecting an area with contamination levels greater than the specified action level AL. |
AL |
The level of elevated constituent we want to detect. |
\(\mu\) |
The background mean. The average contaminant concentration in areas within the decision unit that are not affected by site operations or use. |
\(\sigma\) |
The standard deviation of the increments. This standard deviation represents the variability that results from 1) the small heterogeneities within each increment, 2) the measurement error in the laboratory analysis, and 3) the variability between increments. |
k |
The level of elevated contamination we want to detect, in terms of the number of standard deviations above background. Can be directly specified or calculated as \(k = (AL - \mu) / \sigma\). |
The required inputs for this design and their relationship to the preceding definitions are illustrated in Figure 3 and Figure 4. Figure 3 shows the VSP inputs when entering the action level in terms of k (standard deviations greater than backround), while Figure 4 shows the VSP inputs when entering the action level as a specific concentration level (which requires also entering the increment standard deviation \(\sigma\) and the background mean \(\mu\).
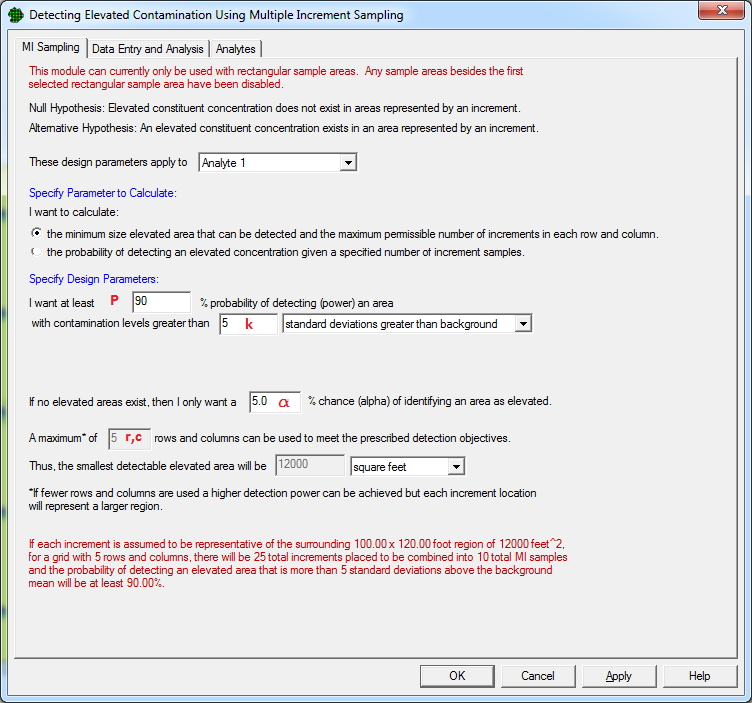
Figure 3: VSP design dialog with parameters for action level in terms of standard deviations above background.
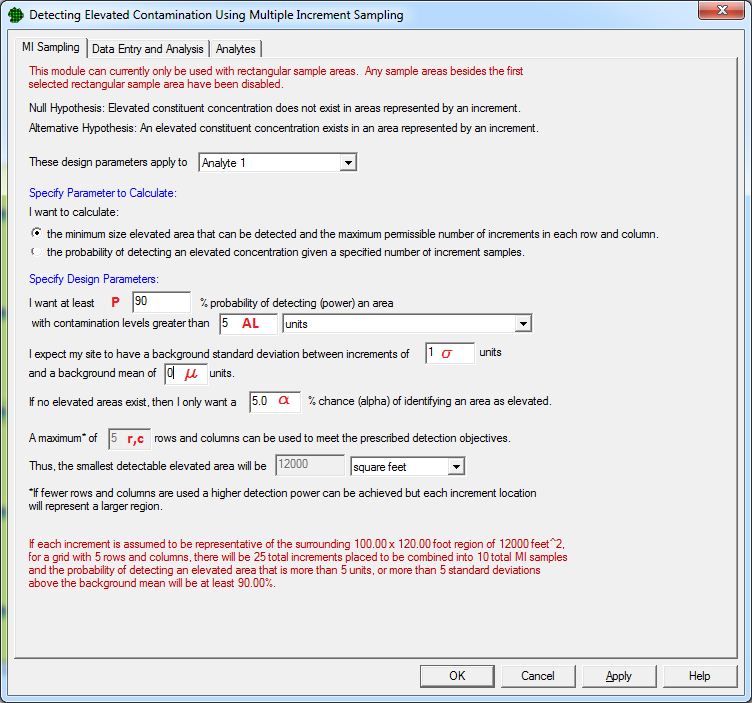
Figure 4: VSP design dialog with parameters for action level in terms of concentration level.
Increments from the site of interest have a known and stationary background mean and standard deviation.
Each increment is representative of the surrounding region
The process of blending the increments makes the composite sample a homogenous representation of all the included increments and that extra variability is not introduced during the process of blending.
Samples within a small distance from each other are similar, i.e. highly correlated.
Concentration levels from the elevated increment(s) to be high enough to overcome the dilution caused by compositing the elevated increments with increments having only background contamination levels.
VSP can calculate either the number of increment samples that can be used to achieve a desired power of detecting contamination above a specified level, or the probability of detected an elevated concentration given a specified number of increment samples.
The number of rows r and columns c (and therefore the number of increments n) required to obtain a desired power of at least P for detecting an elevated increment of k standard deviations above background with a Type I error rate of \(\alpha\) is given by the following equation:
\begin{equation} r + c = \left\lceil \left(\frac{2k}{Z_{1-\alpha}-Z_{1-\pi}}\right)^2-2\right\rceil\end{equation}
where \(Z_{1-\pi}\) is the \((1-\pi)\times100\)th percentile of the standard normal distribution.
The power that is achieved given a specified r and c to detect a level of elevated contamination k standard deviations above background with a Type I error rate of \(\alpha\) is given by the following equation:
\begin{equation} \pi(k) = 1 - \Phi\left(Z_{1-\alpha}-\frac{2k}{\sqrt{r+c+2}}\right)\end{equation}
where \(\Phi\) is the standard normal cumulative distribution function and \(Z_{1-\alpha}\) is the \((1-\alpha)\times100\)th percentile of the standard normal distribution.
Hathaway, J., Walsh, S., Sego, L., Pulsipher, B. (2013). Cross-combined composite sampling designs for identification of elevated regions. Environmental and Ecological Statistics, 20, 69-90.
Jenkins, T., Hewitt, A., Walsh, M., Ranney, T., Ramsey, C., Grant, C., et al. (2005). Representative sampling for energetic compounds at military training ranges. Environmental Forensics, 6, 45-55.
US Army Corps of Engineers. (2009). Interim Guidance 09-02: Implementation of INcremental Sampling (IS) of Soil for the MIlitary Munitions Response Program. US Army Corps of Engineers, Environmental and Munitions Center of Expertise. Huntsville: USACE.
This dialog contains the following controls:
Action Level
Standard Deviation above Background / Units
Detectable Elevated Area Units
Data Entry and Analysis Page