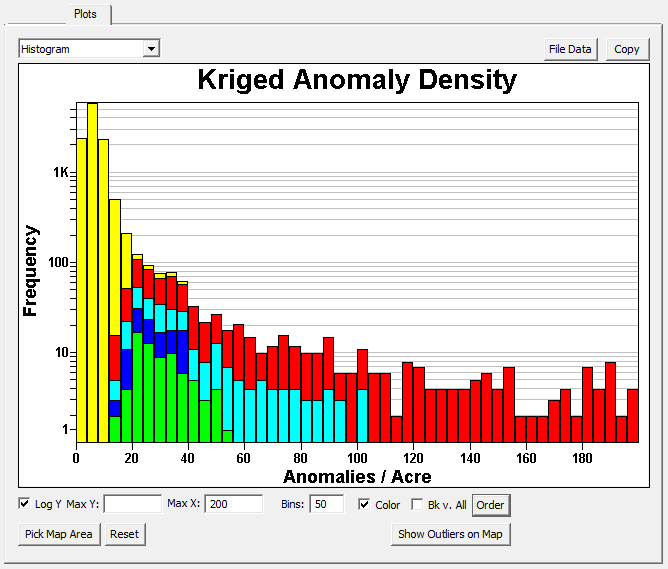
This sub-page of the UXO Data Entry / Plots page displays histograms and box plots of density estimates obtained using the Locate and mark UXO target areas or Geostatistical mapping of anomaly density designs. These graphs are useful for analyzing areas of elevated anomaly density.