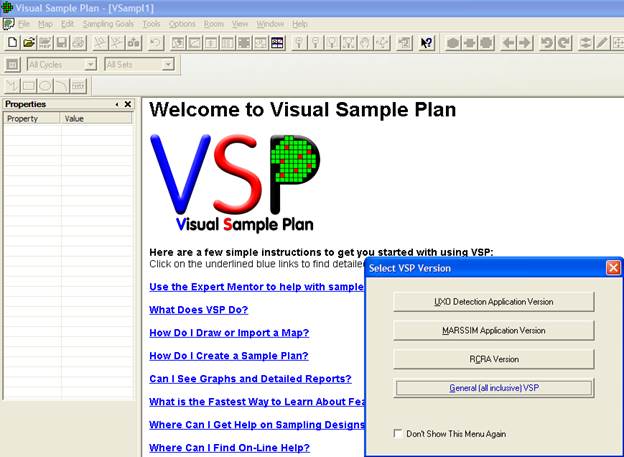
Upon launching VSP, the first screen you will see is "Welcome to Visual Sample Plan" overlain with the initial navigational screen, "Select VSP Version" (Figure 2.1).
Figure 2.1. VSP Welcome Screen with Version Selection Menu
The choice of VSP versions is offered because different versions of VSP have been developed for different sponsors. Versions were designed to simplify the options presented to the single-purpose user as VSP became more complex. For example, the UXO Detection Application Version implements only those sampling designs used for sites which may contain UXO. Users interested only in MARSSIM applications can select the MARSSIM Application Version. That version contains menu items relating to only rooms and surfaces, and its statistical tests and sampling design options are limited to only those that are MARSSIM-approved. Users only interested in RCRA applications can select the RCRA Version, which focuses on designs for monitoring and trends. The General (all inclusive) VSP version provides access to all sampling designs and options.
Having selected a VSP version, you are now at the "Welcome to Visual Sample Plan" screen. The instructions on this page give answers to the most commonly asked questions from new VSP users. This screen will stay up until it is overlain with one of the View options. For example, when a map is loaded and you are in Map View.
You now are ready to begin using VSP. The main toolbar buttons (select View > Main Toolbar to see the buttons) offer a quick, one-click method for performing the primary VSP functions. The pull-down menus offer a wider range of options. Pull-down menus and buttons are shown in Figure 2.2. Holding the mouse over a button will reveal in text what that button does. For example, the Undo button is for undoing a key stroke during a map drawing session.

Figure 2.2. Main Menu Items (top row) and Buttons on the Toolbar (bottom row)
There are 4 separate toolbars: the main toolbar, map drawing toolbar, ranked set toolbar, and room toolbar. These toolbars can be moved around the screen by placing the mouse above the buttons on the toolbar and dragging to another place. Toolbars can be displayed or hidden depending on whether they are checked or not (see View pulldown list).
Starting with the File menu item on the top menu bar, the pull-down menu shows the various options for dealing with Projects.
 VSP uses the term "Project"
to refer to the map, report, sample information, and cost information
associated with one sampling design. All this information is
contained in the 'filename.VSP' file created or selected by the user and
is in a special VSP format. Upon starting VSP, you either create
a new project, File > New Project, or open an existing project,
File > Open Project (Figure 2.3). If
you are creating a new project, you will automatically be put into the
"Welcome to Visual Sample Plan" screen after selecting File
> New Project. If you are opening an existing project,
you will be shown a list of existing VSP files and asked to browse and
select one.
VSP uses the term "Project"
to refer to the map, report, sample information, and cost information
associated with one sampling design. All this information is
contained in the 'filename.VSP' file created or selected by the user and
is in a special VSP format. Upon starting VSP, you either create
a new project, File > New Project, or open an existing project,
File > Open Project (Figure 2.3). If
you are creating a new project, you will automatically be put into the
"Welcome to Visual Sample Plan" screen after selecting File
> New Project. If you are opening an existing project,
you will be shown a list of existing VSP files and asked to browse and
select one.
For help during this section, please refer to the VSP Help Topic Map Menu Commands.
If you are starting a new project, you may obtain a map (drawing) of the site in any of three ways:
1. Import the site map from a drawing interchange format (DXF) file or ArcView SHP file, or import a Geosoft project. VSP supports the following DXF Objects: POLYLINE, LWPOLYLINE, LINE, ARC, CIRCLE, ELLIPSE, TEXT. If you are having problems loading a DXF file into VSP, try converting your file to these types of objects.
2. Import the site map from a previous VSP project that was saved in VSP format (i.e., a .VSP file).
3. Draw the map or Sample Area using VSP's drawing tools.
These three methods are illustrated below. VSP uses the coordinate system associated with the imported map. Because neither DXF nor SHP files contain the distance units, VSP will assume your map is in feet until you change it to some other unit. This is done by selecting Map > Map Settings from the Main Menu. If you want to use a local origin in your design, use Map > Set Origin to click on the map at the location you want to become the new origin (0,0 point). You can also input the current location via the keyboard to become the new origin. If the SHP map is in Latitude / Longitude, rather than a planar coordinate system, VSP will recognize it and offer to convert it to the Universal Transverse Mercator (UTM) system.
You can draw a complex site map in an architectural drawing program such as Autodesk Map© AutoCAD©, or ArcView© and save the drawing to a .DXF or SHP formatted file in that software package. The resulting file can be imported into VSP. You can also import a Geosoft project which contains a map. The Millsite.dxf file is a sample DXF file provided with VSP. The following steps illustrate how to use this file in VSP:
1. From the main menu, select Map > Load Map from File. A quick alternative is to click on the Load Map button on the VSP toolbar.
2. A list of available files in the Visual Sample Plan folder is displayed. Select Millsite.dxf. You may change folder names to search for the desired file using standard Microsoft file-searching if the file is not in the Visual Sample Plan folder. Double-click on Millsite.dxf.
3. Select which layers you want to import from the map file.
4. Choose whether or not you want to import the text embedded in the DXF file.
The site map should appear on your screen as illustrated in Figure 2.4. SHP files loaded in the same manner. Geosoft project files are imported by selecting File > Import > from Geosoft.
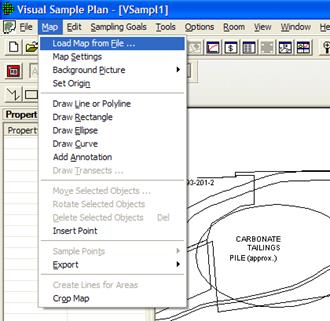
Figure 2.4. The Millsite.dxf File Opened in VSP, showing MAP Pull-down Menu
To open a VSP-formatted file, from the main menu select File > Open Project or use the Open button on the VSP toolbar. A list of available VSP files is displayed. Double click on the .VSP file to be opened. Switch folders and/or directories if the desired file is in another folder or directory.
VSP provides a basic set of drawing tools for users who do not have a drawing program to create a site map. You can experiment with the drawing tools as follows:
Create a new project by choosing File > New Project on the Main Menu or by clicking the New button on the main toolbar. To dismiss the "Welcome to Visual Sample Plan" displayed upon opening a new project, simply commence one of the drawing operations outlined below or an operation in Map > Map Settings. If the project window is not full screen, expand the project window by pressing the Maximize button on the upper right corner of the project window.
Choose View > Map Drawing Toolbar from the Main Menu. This displays a toolbar used specifically for drawing a map. This toolbar also may be docked if you prefer to move it from the project window. To dock the drawing toolbar, place the mouse cursor on the blue title bar and drag the drawing toolbar onto the VSP toolbar.
All the drawing functions described below also are available from the Main Menu option Map.
Draw Line. Click the Draw Line button on the toolbar, or select Map > Draw Line or Polyline. The cursor will become a cross, indicating that you are in drawing mode. Click a point on the map. You will now see a line between the cursor and point you clicked. Continue clicking points to make a complex polygon. If you make a mistake, click the Undo button on the VSP toolbar (or select Edit > Undo from the Main Menu or press Ctrl-Z on the keyboard). This will remove the last point you entered.
Points can also be entered on the keyboard. Just enter the x, y coordinates for each point (for example: type 32,48 and press the Enter key). You can see the coordinates that you are entering on the status bar at the bottom of the window. To connect a line to a point already entered (for example, to connect the last line to the first point to create a closed polygon), hold the Shift key while clicking with the mouse. Holding the Shift key can be used in most drawing operations to select the nearest point on the map without having to carefully position the cursor. Holding the Ctrl key while moving the mouse allows you to draw a horizontal or vertical line without having to be careful. To finish the line, right-click the mouse or click the Draw Line button on the toolbar again.
Draw Rectangle. Click the Draw Rectangle button on the toolbar, or select Map > Draw Rectangle. Click on a point on the map that you want to be one corner of a rectangle. Holding the Shift key while clicking causes that point to be attached to an existing point on the map. Move the cursor to the opposite corner of the rectangle and click the mouse button. Holding the Ctrl key while moving and clicking forces the rectangle to be a square. The x, y coordinates of the corner points can be entered on the keyboard also. A rectangle of a specific size can be defined by typing the dimensions (for example: type 200x100 and press the Enter key). You can see the dimensions that you are entering on the status bar at the bottom of the window. The rectangle of the specified size will be created with its lower left corner at the coordinate 0,0.
Draw Ellipse. Click the Draw Ellipse button on the toolbar, or select Map > Draw Ellipse. Drawing an ellipse is basically the same as drawing a rectangle. Holding the Ctrl key forces the ellipse to be a circle.
Draw Curve. Click the Draw Curve button on the toolbar, or select Map > Draw Curve. Click a point on the map. Click a second point on the map. A line is drawn between these first two points. As you move the cursor around the map, this line is stretched to become a curve. When the curve has the shape you want, click the mouse (this is the control point). The x, y coordinates for the three points also can be entered on the keyboard.
Add Annotation. Notes (also called note objects) can be added to maps using the annotation tool. Select Map > Add Annotation, and the cursor becomes a crosshair. Click on the map at the location where you want to add the note object. The location may also be entered on the keyboard. A default object containing the text "Right-Click Here" is added to the map.
After the default object is added, use the mouse to right-click on the note object. A Map Label Information dialog box pops up, as shown in Figure 2.5. You will be able to change the following parameters:
Note text
Anchor point on map
Anchor point to screen
X and Y coordinates of anchor point (map or screen)
Border, background color, and font
Alignment (left/center/right, top/center/bottom)
VSP imports DXF and SHP files and turns the objects into polylines or a series of connected points. Lines and note objects on the map can be selected by clicking on them with the mouse. When an object is selected, a small black box appears at each vertex, or point, on the object. Polylines appear as a series of vertices. Hold the Ctrl key down while clicking to toggle the selected status of a single line or note (annotation) object.
Several lines may be selected by using a rectangular area. To do this, position the mouse at one corner of the rectangle then press and hold the left mouse button down while moving the mouse to the opposite corner of the rectangle. When the mouse button is released, all the lines and notes that pass through the rectangle will be selected. Use the Ctrl key to keep previously selected lines and note objects.
Move Selected Objects. Use this dialog by selecting Map > Move Selected Objects to move the selected objects by the given offsets. Objects may also be moved by using the mouse. Position the mouse over a selected line or note object. Press and hold the left mouse button while moving the mouse to the new position. When the mouse button is released, the selected lines will be placed at the new position. This command applies to both map lines and note objects.
Rotate Selected Objects. After selecting Map > Rotate Selected Objects, enter the pivot point by clicking with the mouse or entering the coordinates on the keyboard. Then enter the angle of rotation by moving the mouse and clicking or entering the degrees on the keyboard. This command affects all selected objects on the map.
Delete Selected Objects. This command deletes selected objects from the map (Map > Delete Selected Objects). This action cannot be undone.
Insert Point. After selecting Map > Insert Point, click on the map with the mouse. A new vertex point is inserted in the nearest polyline on the map. If the polyline matches a sample area, then a matching vertex is also inserted into the sample area. An individual point can be selected by holding the Shift key while clicking on the point, allowing it to be dragged to a new location. Holding the control key will keep the point aligned vertically or horizontally. Selecting a segment is done in much the same way by holding the Shift key while clicking on a segment between two points, dragging it, and holding the Ctrl key to keep alignment vertical or horizontal.
Deleting Segments of a Map. If you want to remove a segment from either an imported map or a user-drawn map, you may click on a segment and hit the Delete key on your keyboard. Left-clicking on any segment in a map displays the vertices of the polyline in an outline of bold squares. With the outline in bold squares displayed, hit the Delete key on your keyboard and that segment is removed.
Map Buttons on the Toolbar. The Zoom In, Zoom Out, Zoom Window, Zoom Max, and Pan buttons in the middle of the VSP toolbar (and as pulldown items under Main Menu option View) provide methods to focus in on a Sample Area or other region of a site map. Press once on the Zoom In button and then click on the site map to make it grow larger. Turn off this mode by pressing the Zoom In button again. The Zoom Out button works the same way except that it makes the site map shrink. The location on the site map where you click determines the area of the new focus.
The Zoom Window button allows you to create an expanded rectangular window into the site map. For an example, press the Zoom Window button, drag the cursor across part of the screen, and release. The dashed lines illustrate the final window focus.
The Zoom Max button displays the map at the largest size that will fit the current view. VSP uses the current map extents to determine how the map will be positioned. Use Map > Map Settings to adjust the minimum / maximum x and y coordinates to use for this operation.
The Pan button repositions the map in the view window. Hold the left mouse button while dragging the map to a new location. When the left mouse button is released, the map will be redrawn at the new position.
The remaining pull-down menu items under MAP are specialty topics, some of which are discussed in other sections of this manual. They will be briefly defined here.
Sample Points imports and exports sample points to text files. It is discussed in Section 2.5. Export exports a map and/or samples to various file formats. Draw Transects allows you to manually create transects on the map. To draw transects on the map you must first enter the width of the transects in the dialog that appears. Transects will only be added inside of existing sample areas. If you draw outside sample areas, the transects will be clipped at the edge of the sample areas. This command works similar to the Draw Line command. Right-click with the mouse or re-select this command to stop drawing. This command is useful for creating transects to be analyzed with Sampling Goals > Find Target Areas and Analyze Survey Results (UXO) > Assess probability of target area traversal based on actual transect pattern.
Map> Background Picture > Load from file loads a background picture from a graphics file into VSP. VSP comes with two sample pictures: VSPEx1 and VSPEx2. Once a picture file is loaded into VSP, sample areas can be located on the picture similar to how they are located on a map. Map > Background Picture > Calibrate Picture to Map matches the background picture to the sampling map. Map > Background Picture > Calibrate Google Earth Image allows you to use an image obtained from Google Earth and calibrate it to the VSP sampling map. Map >Background Picture > Load World File can be used if a Picture World File is available for the background picture. VSP's Help > Help Topics > Menus > Map Menu > Background Picture > Calibrate with Map describes this process in detail. Map > Background Picture > Save World File takes a background picture that has been calibrated either through loading a world file or by manually calibrating the picture, and writes a world file to save the picture calibration information. Figure 2.6 shows the background picture VSPEx1 loaded into VSP with a yellow sample area labeled "Sample area 1" placed on the picture. Activating View > Transparent Sample Areas will show Sample area 1 as a yellow outline with background image rather than having yellow fill.
Create Lines for Areas creates outlines around sample areas that don't currently have them. These outlines are important, because they allow you to edit the size and shape of a sample area.
Crop Map removes portions of a map that are not currently visible on the view window. It is useful for removing large amounts of extraneous map lines that tend to slow down the display and other map functions.
Refer to Section 6.1.3 for a discussion of using CAD drawings of building floor plans to delineate rooms/sampling areas within the floor plan drawings.
For help during this section, please refer to the VSP Help Topic Edit > Sample Areas Menu.
Once a map is created, a Sample Area must be created. A Sample Area is a region in which to locate samples. While most sample areas are enclosed, one of the Sampling Goals in VSP, Establish Boundary of Contamination, allows for an open type of sample area -- samples are located along a boundary. The user must identify the area to VSP in order to make sampling locations available. (Note: Sampling designs which generate sample sizes can be used without a Sample Area defined, but they will not create sampling locations, only sample sizes.)
Press the New Area button on the VSP toolbar (or from the Main Menu select Edit > Sample Areas > Define New Sample Area). A Color dialog box appears (Figure 2.7). Use this dialog to choose the color of the Sample Area. After the color is selected, a tooltip box appears on the map to provide information on the selection method. Figure 2.8 shows a red Sample Area along with the dialog boxes for creating it. Repeat the operation to create a second Sample Area.
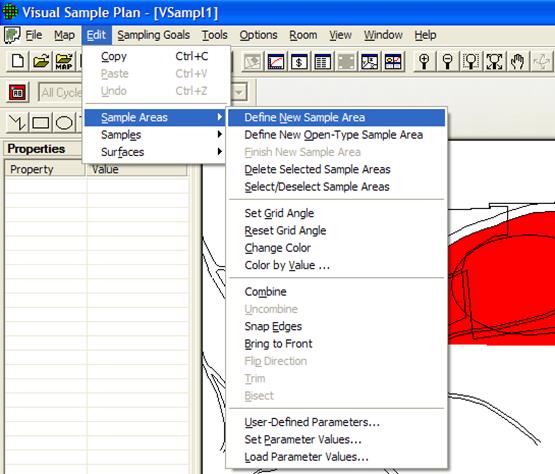
Figure 2.8. Define New Sample Area
There are two basic ways in which to create the Sample Area:
1. One-Step Method. Position the cursor inside one of the enclosed areas on the map and right-click with the mouse. The Sample Area is created, and a dialog box appears. This dialog box shows the size of the Sample Area. Click the OK button on the dialog when done.
2.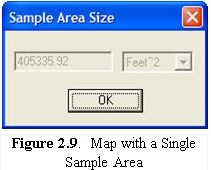 Corner-Selection Method. Position
the cursor on each corner of the Sample Area and left-click with the mouse. If
you hold down the Shift key while clicking, the nearest point on the map
will be selected. If you make a mistake in choosing a corner,
use the Undo feature. When you have finished defining
the Sample Area, either click the Finish Area button on the VSP
toolbar, select Main Menu option Edit > Sample Areas > Finish
New Sample Area, or right-click the last segment in the corner selection
method. The area dialog box appears (Figure 2.9). Note:
A Sample Area cannot cross over itself. If this happens, an
error message-"This area is not valid and will be removed"-appears.
Corner-Selection Method. Position
the cursor on each corner of the Sample Area and left-click with the mouse. If
you hold down the Shift key while clicking, the nearest point on the map
will be selected. If you make a mistake in choosing a corner,
use the Undo feature. When you have finished defining
the Sample Area, either click the Finish Area button on the VSP
toolbar, select Main Menu option Edit > Sample Areas > Finish
New Sample Area, or right-click the last segment in the corner selection
method. The area dialog box appears (Figure 2.9). Note:
A Sample Area cannot cross over itself. If this happens, an
error message-"This area is not valid and will be removed"-appears.
A map may contain a single Sample Area or multiple Sample Areas. For example, the VSP project file OneAcre.VSP (an example of a VSP file included with the program) is a single Sample Area, while Example1.VSP could have multiple Sample Areas because the map consists of several enclosed areas that could be selected as Sample Areas. When multiple Sample Areas are selected, samples located on the map by VSP are distributed across all the areas. When multiple samples area are combined using the VSP Combine Areas toolbar button or the Edit > Sample Areas > Combine menu selection, the combined area is treated as a single area (see Section 2.3.5 for a discussion of combining sample areas).
VSP provides sample design support for boundaries that do not completely surround a sample area. For instance, suppose it is reasonable to assume that the only portion of the boundary that could be breached by soil contamination is along the downhill side of the Sample Area. In that situation, the VSP user first clicks Edit > Sample Areas > Define New Open-Type Sample Area. Then the user places the cursor at the starting location of the desired partial boundary and clicks on each vertex along the boundary line until the end of the boundary of interest is reached. Then a click of the right mouse button finishes the creation of this partial boundary. An example of a partial boundary is shown as a red line in Figure 2.10.
Alternatively, the user may create an open-type sample area (partial boundary) using the single-click method. This is accomplished by selecting Edit > Sample Areas > Define New Open-Type Sample Area from the menu and then right clicking on an existing line on the map. The boundary may be shortened by selecting the Edit > Sample Areas > Trim from the menu and then clicking on two points on the boundary.
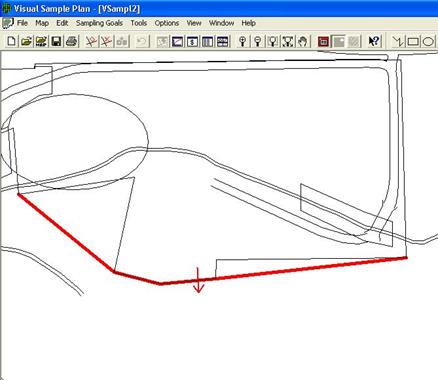
Figure 2.10. Example of an Open Boundary with an Arrow to Show the Direction the Soil Contamination would be Expected to Move (note that the arrow points toward the clean side)
During the boundary selection process, VSP places an arrow on the boundary. This arrow points in the direction that contamination in soil may be expected to move, if such movement has or were to take place. If VSP points the arrow in the wrong direction, the direction of the arrow can be reversed by clicking Edit > Sample Areas > Flip Direction.
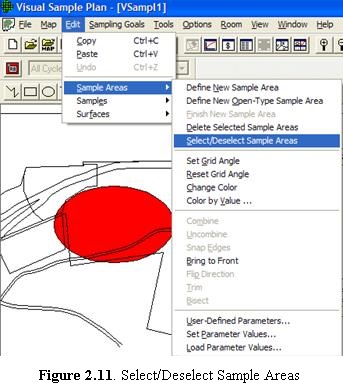
VSP allows the user to control which Sample Areas are available for locating samples. Creating a Sample Area automatically "selects it" for locating samples. You know it is "selected" because it appears in a solid color on the map. "Deselected" Sample Areas appear with only the outline of the Sample Area in color and the interior blanked out. You may Select or Deselect
a Sample Area in four ways: 1) left click within the Sample
Area, 2) right-click on a sample area and change the Selected checkbox
on the Sample Area Information dialog box, 3) check/uncheck the
box for the sample area in the Layer Control Bar, or 4) from the
Main Menu select Edit> Sample Areas > Select/Deselect Sample
Areas (see Figure 2.11). The latter method brings
up a dialog box that allows you to choose which areas to select or deselect. Figure
2.12 shows a dialog with three areas selected and one area deselected.
Note that VSP automatically names the Sample Areas: Area 1,
Area 2, Area 3, and Area 4 according to the sequence in which the
 areas were created. The
names can be changed in the Sample Area Information dialog box
discussed in Section 2.3.4.
areas were created. The
names can be changed in the Sample Area Information dialog box
discussed in Section 2.3.4.
If you make a mistake, or just want to delete one or more of the Sample Areas you created, you must first make sure the Sample Area(s) is selected (see above). Then, from the Main Menu, choose Edit > Sample Areas > Delete Selected Sample Areas. Be sure to deselect any sample areas that you want to save.
VSP automatically generates certain parameters for Sample Areas, such as the name, area and perimeter. This information can be accessed by right-clicking on the sample area on the map. The Sample Area Information dialog box for Area 3, the big red ellipse, is shown in Figure 2.13.

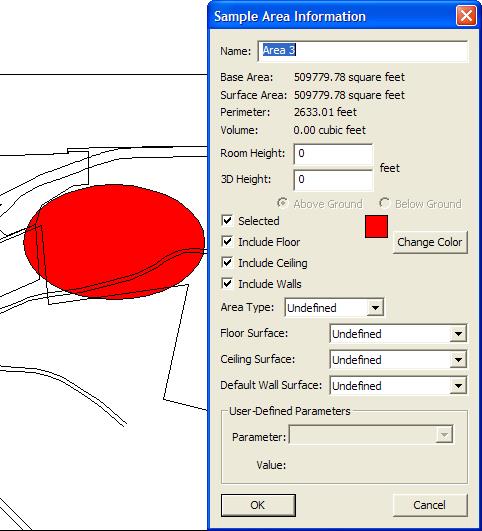
Figure 2.13. Information Dialog Box for a Sample Area
Some parameters such as Name and Selected status can be changed in this dialog box. You will note parameters that refer to rooms in this dialog box. These will be discussed in Section 2.5. Briefly, Rooms are just Sample Areas with height greater than 0, so the same dialog box is used for both Sample Areas and Rooms.
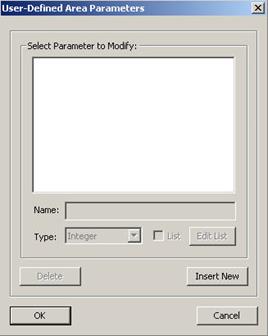
VSP allows the user to define parameters for Sample Areas. These are called User-Defined Parameters. To create User-Defined Parameters, from the Main Menu select Edit > Sample Areas > User-Defined Parameters. A dialog box as shown in Figure 2.14 is displayed.
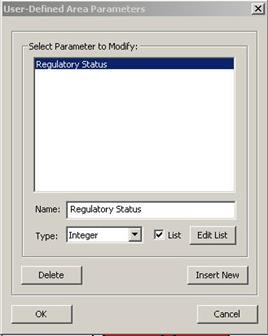
Press the Insert New button, and default values appear in the windows. Say you want to define a new parameter for Sample Areas and name it "Regulatory Status". Type "Regulatory Status" in the Name box. Say you select "Integer" for Type, and check the List option. List lets you limit the values assigned to Regulatory Status to those you supply. Figure 2.15 displays the dialog box for User Defined Area Parameters.


With a parameter highlighted in the Select Parameter to Modify window, hit the Edit List button. A new dialog box titled Parameter List Values comes up (see Figure 2.16). The user inputs values to this list by putting the mouse on a current value, hitting return, and typing the next value into the list. The list contains the valid arguments for that parameter.
Once a new parameter is defined, that parameter is attached to (or defined for) all Sample Areas. You may want some Sample Areas to have one value for the parameter, and other Sample Areas have another value. Parameter values may be set in the Sample Area Information dialog or by the Edit > Sample Areas > Set Parameter Values menu command. Shown in Figure 2.17, the Set Parameters dialog box allows the user to assign parameter values to Sample Areas based on a condition. The example says to set the parameter Regulatory Status to the value "4" for Sample Areas that have a Base Area (one of the VSP-defined Sample Area parameters) greater than or equal to 100 square feet. The Set Parameters dialog box has many pull-down lists, making it easy for the user to quickly set parameter values for Sample Areas.
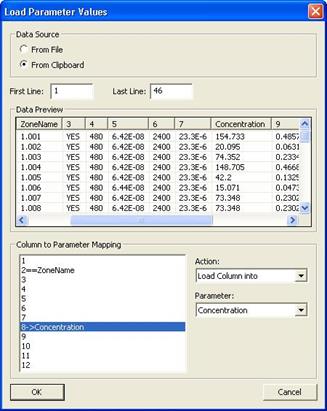
If the user wants to set the value of built-in and user-defined parameters for sample areas or rooms from previously defined sources, use the Edit > Sample Areas > Load Parameter Values. Figure 2.18 is an example of loading parameter values into VSP from an external table. Currently, VSP only supports Tab delimited text for the input file or from the clipboard. The source would be a row/column table where parameter values are defined. The user uses the Column to Parameter Mapping to specify whether a column in the table is to be compared to a parameter or whether the column should be loaded into a parameter. For a complete discussion of this tool and an example, use the Help tool - select the "?" button on the toolbar, and move the cursor to Edit > Sample Areas >Load Parameter Values.
There are several other features that deal with Sample Areas:
Set/Reset Grid Angles. Use this command to align gridded samples for selected sample areas. Left-Click with the mouse on one vertex of a sample area, then Left-Click on an adjacent vertex of a sample area. (Hold the shift key while clicking to select the exact point on the map.) Use the Reset Grid Angle command to change the grid angle back to its default setting.
Change Color. Use this command to change the color of all selected sample areas. The chosen color will also be the default color for subsequent new sample areas.
Color by Value. Use this command to automatically color all sample areas (or rooms) based on the value of a built-in or user-defined parameter. Select one of the defined color sets to use for coloring the sample areas. Some color sets are gradient-based and some are discrete. Select one of the built-in or user-defined parameters to use for coloring the sample areas. Use the log scale box to color scale the parameter according to the logarithm of its value. Only certain parameters can be log-scaled. Check the Color by Value box to color the sample areas by the value of the given parameter. Uncheck this box to turn off this automatic coloring feature.
Combine. This command combines sample areas or creates interior holes in sample areas. To combine sample areas, select 2 or more non-overlapping sample areas on the map and use this command. The sample areas are combined so that they are treated a a single sample area. Clicking on one part of the sample area will select or deselect all the attached parts of the sample area. All the attached parts are treated as a single sample area for the purpose of sample placement. See Help > Help Topics > Menus > Edit menu > Sample Areas > Combine for an example. Use Uncombine to reverse the effect of the Combine Sample Areas and breaks combined sample areas into the component areas.
Snap Edges. When edges and corners of adjacent sample areas to not exactly match up, use this command to perfectly align them. The edges must be fairly close to each other, they may even overlap slightly. After using this command, the edges will not overlap nor have any space between them.
Bring to Front. Use this command to bring the selected sample areas to the end of the draw list causing them to be drawn last. This will, in effect, cause them to appear in front of other sample areas. Use this command for sample areas that exist inside the hole of another sample area and cannot be seen. Note that this command changes the sample area numbers.
Flip Direction. This command switches the contaminated / uncontaminated side of the open-type sample area. The arrow points toward the uncontaminated side.
Trim. This command allows you to shorten the open-type sample area. After selecting this command, the cursor becomes a cross-hair. Use the mouse to click on two points on the open-type area. After the second point is selected, the area will be truncated at the two points.
Bisect. Use this command to split a sample area into one or more parts. To bisect: (1) Draw a line on the map that crosses the sample area one or more times, (2) Select the line, (3) Choose this command from the menu.
For help during this section, please refer to the VSP Help Topic Layer Control Bar.
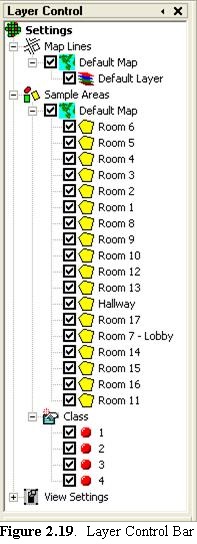
The Layer Control Bar (Figure 2.19) is displayed by selecting View > Layer Bar. The Layer Control provides quick access to turning on / off:
Map Lines
Sample Areas
View Settings
The power of the Layer Control lies in its ability to turn off multiple map lines or sample areas based on different organizing criteria. Another powerful feature is that each View Window in VSP has independent Layer settings - so each window can display different map lines, sample areas, etc.
 2.4.1 Map Lines
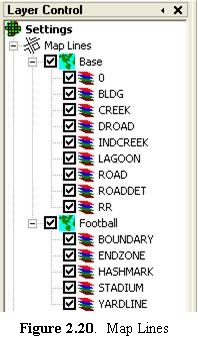
The display of map lines can be turned on or off using the Layer Control. By checking the box next to the name of the map, all the lines for the map can be toggled. In Figure 2.20, there are two maps: Base and Football.
If the map that was loaded is a DXF file, it may contain more than one Layer. If so, the lines for individual layers can be toggled by checking the box next to the names of the individual layers. In Figure 2.20, the Base map contains layers named 0, BLDG, CREEK, etc. and the Football map contains layers named BOUNDARY, ENDZONE, etc.
Individual sample areas can be turned on or off by checking the box next to the name of the sample area. If the VSP project contains multiple maps, all the sample areas associated with a map can be toggled by checking the name of the map under the Sample Areas category. In Figure 2.21, there are two maps (which are two floors in a building): ccbasement and ccmainfloor. By checking the box next to ccbasement, all the sample areas associated with the map ccbasement will be toggled on or off. This makes it easy to work with the floors of the building individually - if desired. In addition, because each View Window has independent layer settings, one window can view the basement and another window can view the main floor.
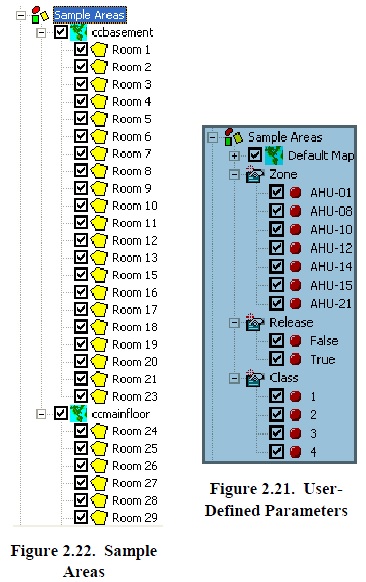
When user-defined sample area parameters exist, VSP can toggle sets of sample areas bases on those parameters. In Figure 2.22, there are 3 parameters that can be used to toggle sample areas: Zone, Release and Class. By checking or unchecking the box next to AHU-01, all the sample areas that have Zone AHU-01 will be turned on or off. This makes it easy to work with blocks of rooms based on characteristics such as air handling unit zone, contamination class, etc. Note that only parameters that are logic or lists can be used in the Layer control.
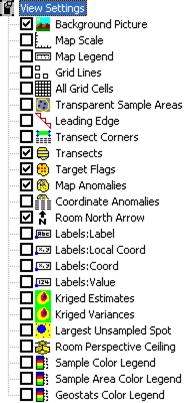
Most of the items on the map that can be displayed by toggling them on/off from VSP's View menu can also be toggled on/off using the View Settings section of the Map Layers bar. Figure 2.23 shows that for the current project's map, the Background Picture, Transects, Target Flags, Map Anomalies, and Room North Arrow are being displayed.
The Properties Bar allows quick access to view and edit the properties of certain project items. Currently, you can use the Property Bar to edit:
Sample Areas
Samples
The Properties bar is toggled on/off using View - Properties Bar.
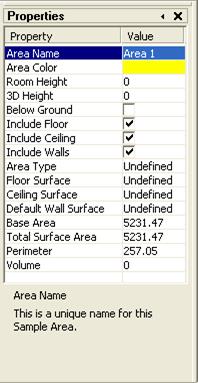
When you click on a Sample Area on the Map View or in the Layer Control Bar, the Property Bar is filled with the various properties or parameters related to the selected Sample Area (Figure 2.24). Some of these properties (such as Area Name) can be edited. Some of the properties (such as Total Surface Area) are read-only. When you click on one of Properties (or navigate to it with the keyboard), a description of the Property is displayed at the bottom of the Property Bar.
When you right-click on a Sample on the Map View, the Property Bar is filled with the various properties or parameters related to the selected Sample. As with Sample Areas, some of the properties can be edited and some are read-only.

For help during this section, please refer to the VSP Help Topic Data Entry Sub-page.
Individual samples have several attributes within VSP:
location (x, y, z coordinates) and local coordinates (lx, ly)
type (sampling design used to collect them)
surface (on which surface it is located)
label (descriptive text)
value (numerical value)
shape (marker symbol)
historical sample indicator (true/false indicator)
Some of these attributes are relevant for only certain functions within VSP and are explained in future sections.

The primary way you will locate samples within a Sample Area is by pressing the Apply button from one of the dialogs once a Sampling Goal is selected from the Main Menu. This process is described in Chapter 3. Samples located in this way are automatically assigned Location, Type, Surface, and Shape. Samples that are imported and samples that are located manually do not have the same status as those located by VSP using a statistical approach. Imported samples and manually located samples must be assigned attributes by the user.
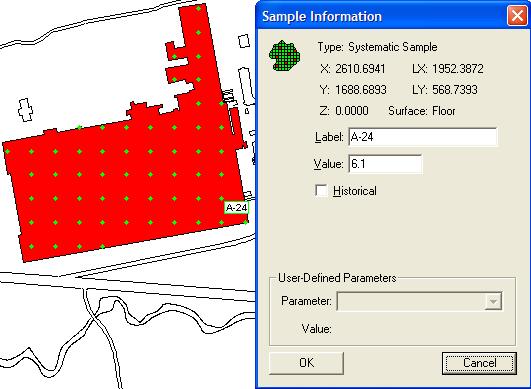
Sample attributes can be displayed using the Sample Information dialog box. With the map displayed, right-click on an individual sample. A Sample Information dialog box appears that displays current sample information. Information such as Label and Value can be assigned using this dialog box. In Figure 2.25, we see the VSP file Example 2, after right-clicking the right-most sample in the third row up from the bottom. We assigned that sample a Label of "A-24", and a value of "6.1". The fact that the Historical box is not checked means this sample originated from VSP by applying one of the VSP Sampling Goals (rather than being imported into VSP as part of an earlier sampling effort).
Most VSP sampling goals which generate samples have a Data Analysis tab which contains a Data Entry sub-page. When creating a sampling design for a sample area on a map, the samples generated will appear in the data entry sub-page. Alternatively, if you have not created a sample area on a map and have generated sample sizes in VSP, the data entry window will initially appear blank, but data can still be entered later into VSP. The process of generating samples is explained in depth in Chapter 3.
When samples are generated for a sample area on a map, the samples will appear in the data entry tab. The displayed values can be edited and the changes are made permanent by clicking "Apply".
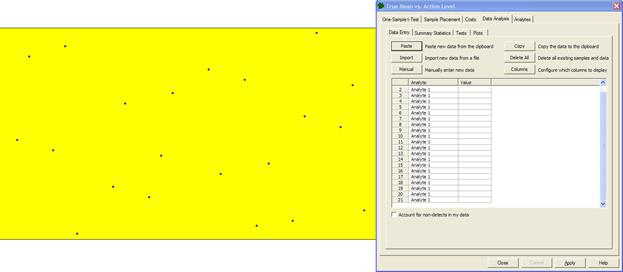
Figure 2.26 Data Entry Sub-Page
 2.5.1.1 Columns
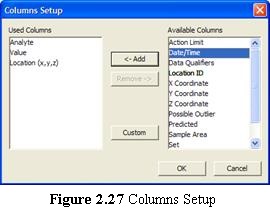
The column configuration may be sparse initially as in Figure 2.26, but the number of columns displayed can be expanded by pressing the Columns button to configure which columns to display. Pressing the Columns button brings up the Columns Setup window as shown in Figure 2.27. Columns can be added to the configuration by selecting the relevant column(s) under Available Columns and pressing Add. Likewise, columns can be removed from the configuration by selecting items under Used Columns and pressing Remove. Pressing Custom will bring up VSP's user defined-parameters dialogue for defining additional columns. The column definitions are as follows:
Action Limit - The action level or value of concern for an analyte. Usually a value stated in the sampling goal's null hypothesis.
Analyte - The name of the chemical or analysis in the sample design and the data analysis. Examples: Arsenic, Trichloroethylene, etc. When this column is used, each measurement is displayed in a separate row, and Analyte will refer to what was being measured for that row of data.
Analyte (Name) - Often multiple analytes are displayed in different columns such as in a spreadsheet. When importing, select "Analyte ()" and you will be prompted to enter the name of the analyte for each column.
Data Qualifiers - Usually this is a column with information where certain values indicate that values are non-detects.
Date/Time - The date and time the data was collected.
Location (x,y,z) - The x, y, and z coordinates of the sample.
Location ID - An ID unique to each sample. Using sample IDs is the best way to assure data is imported into VSP correctly.
Value - the measured value for an analyte.
X coordinate - The coordinate measured along the x axis, or left-to-right direction on a map.
Y coordinate - The coordinate measured along the y axis, or bottom-to-top direction on a map.
Z coordinate - The coordinate measured along the z axis, or height direction.
Possible outlier - This identifies values which stand out from the main group of values - usually identified by a specific test.
Predicted - In modules involving trends over time, if a model generated outside of VSP yielded predicted values, these can be imported into VSP using this column distinction.
Sample area - This identifies the sample area in which a sample is located.
Set - For mean vs. reference designs, this indicates whether the sample belongs to the reference area (R) or the study unit (S,S1,S2,etc.).
Units -Indicates the measurement units (ug/L, mg/kg, ppm, etc.) associated with the Value.
If the data entry tab is populated with sample information, clicking the Copy button will copy the displayed columns into a tab delimited format which can be pasted into a spreadsheet or text file. This is often done after a sampling design is generated to export the sample locations outside of VSP.
Selecting Delete All and then clicking Apply will remove all of the data from the data entry tab. This is available for cases where samples collected differ from the VSP sampling design and it is easiest to clear VSP's sample information and import the new data. Note that this will also delete sample locations from the map.
If data outside of VSP is in a tab delimited format (usually the default format in a spreadsheet), it can be pasted into VSP by selecting and copying the data outside of VSP, then clicking the Paste button in the data entry tab. The data copied from a spreadsheet (Figure 2.28, left) will be displayed in VSP in the Add Data window (Figure 2.28, right) where columns and row specifications are made.
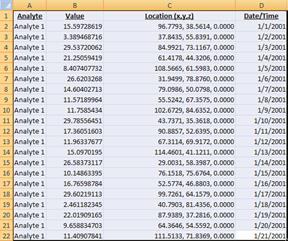
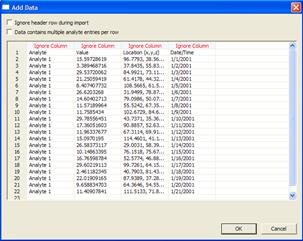
Figure 2.28 Spreadsheet Data Pasted Into VSP
In the Add Data window, if the first row is a header row, clicking
the "Ignore header row during import" box at the top of the
window will hide it and ignore it when importing data. When
importing data into VSP, the column names are initially labeled "Ignore
Column" (in red text in Figure 2.28, right). Clicking
on these column names brings up a list of the available column names in
VSP from which to select from as shown in Figure 2.29. Leaving
a column name as "Ignore Column" means it will not be imported. When
the desired columns have been assigned their column names, clicking OK
will import the data and display it in the data entry tab. 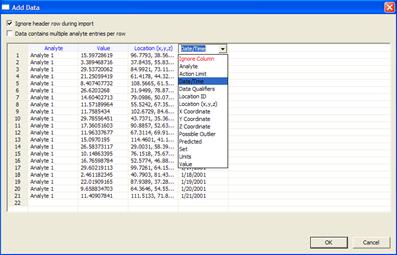
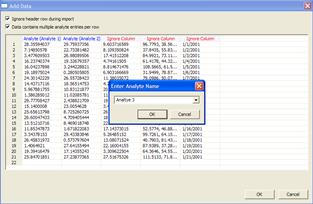
When sample data contains multiple analytes, and the analytes' measured values are in separate columns like in the spreadsheet shown in Figure 2.30, left, the "Data contains multiple analyte entries per row" option at the top of the Add Data window can be checked to simplify data entry. When this box is checked, "Analyte (Named)" can be selected for the column name(s) as shown in Figure 2.30, right, and VSP will prompt the user for the analyte's name as shown in Figure 2.31. The name can either be typed or can be selected by clicking the drop down button.

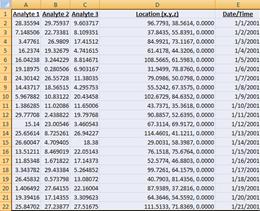
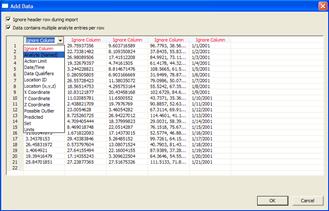
Figure 2.30 Analyte Data in Multiple Columns
Some important distinctions when pasting or importing data into VSP are:
Previously existing samples already in VSP will not be deleted.
Imported samples will be merged with existing samples if their information is the same. Generally this occurs only if the imported data appends the old data, such as filling in a blank. If any non-blank fields differ, VSP will treat the new data as a separate sample and will not merge the two.

Clicking Import works much the same way as using Paste, with the exception being that you select a file to import rather than pasting the data in. The file must be a text file in tab delimited format. After clicking Import, the Import Date File window will open (Figure 2.32, left) and you must locate the file, select it, and click Open. The data will then be displayed in the Add Data window (Figure 2.32, right), and from there the process is the same as it is when using Paste.
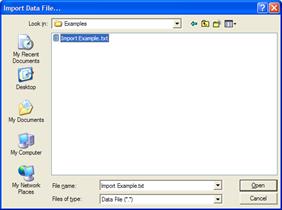
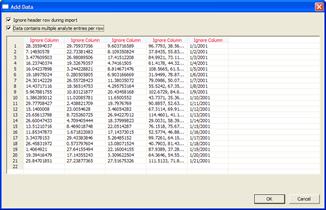
Figure 2.32 Import Data File
Clicking the Manual button allows for manual entry of data into VSP. This will bring up an Add data window which contains the columns currently being displayed in the data entry tab (Figure 2.33, left). The cells can be populated by clicking on the individual cells. When clicking on a cell, you will be prompted to either type in the value or select items from a drop down list (Figure 2.33, right).
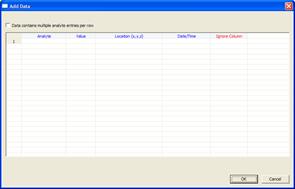
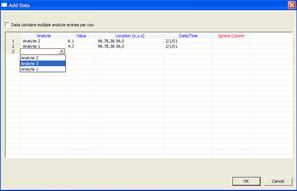
Figure 2.33 Manual Data Entry
There are two other ways to import sampling locations without using the Data Entry sub-page:
1. Copy them from the Windows Clipboard. Edit the coordinates in a text editor, a word processor, or a spreadsheet. Each line (or row) represents a different sampling location. The first column is the x coordinate; the second column is the y coordinate. The third column is the sample Type and is optional. Valid sample Types are Random, Systematic, Hotspot, Manual, Adaptive-Fill, Unknown, Transect, Compliance Transect, Meandering Transect, Ranked Set, Cluster, Grid Cell, Perimeter, Collaborative, Hot Spot Cell, and Increment. The fourth column is the sample label and is optional. Spaces or tabs should separate columns. (Tabs are preferable.) The coordinates must lie inside a selected Sample Area.
Example: Type the following coordinates into a text editor such as Notepad:
10 |
10 |
Random |
50 |
10 |
Systematic |
10 |
50 |
Hotspot |
95 |
60 |
Manual |
99 |
99 |
Adaptive-Fill |
150 |
150 |
Unknown |
Now press Ctrl-A to select all the text and Ctrl-C to copy the text to the Windows Clipboard. Run VSP and load OneAcre.Vsp. Select the Main Menu option View > Coordinates. Paste the coordinates into VSP using either Ctrl-V or Main Menu option Edit > Paste. View the new sampling locations using the Main Menu options View > Map or Window > Quad Window. Your map view should now look like Figure 2.34.
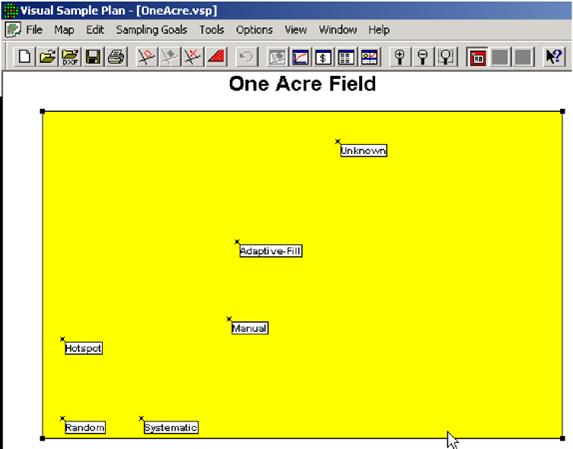
Figure 2.34. The OneAcre.VSP Project with Sampling Locations Added from Windows Clipboard
You can place the mouse on any sample point and right-click to see the attributes of the sample at that sample Location. Figure 2.35 shows the Sample Information VSP has for the sample near the arrow.
2. Import sampling locations from a text file. The text file must be formatted as described above. Choose Main Menu option Map > Sample Points > Import and enter the file name in the dialog box.
Samples that are imported are assigned Shapes depending on the Type attribute assigned. Sample Type can be edited by selecting Edit > Samples > Shapes from the Main Menu. A newer, preferred method of changing the sample shapes is by using the menu Edit > Samples > Symbols. The Dialog box that appears shows both the shapes assigned to valid Types (use the pull-down menu to select among valid Types), and gives a picture of the Shape. Figure 2.35 shows that when a sample was collected according to a Manual design, it will be displayed with a Small Square within a Large X Shape.
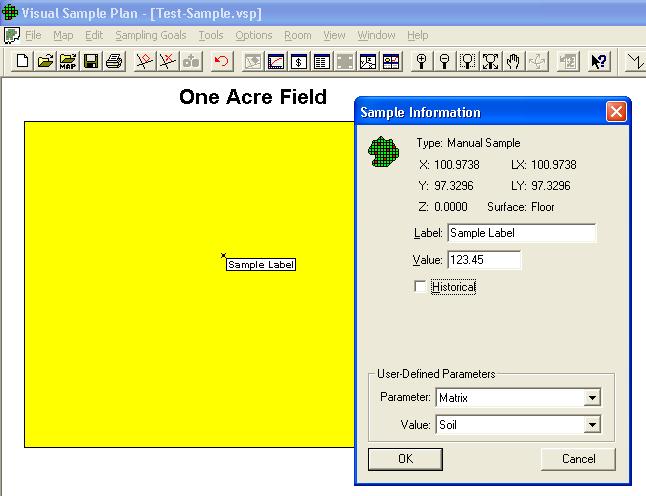
Figure 2.35. Example of Sample Information Box
Sample locations with the Historical box checked have a unique role in VSP. VSP gives you "credit" for them in accounting for the total number of new samples needed. This is explained in Section 3.2. The important point to remember here is that if you import samples, manually add samples, or have a sampling design previously created within VSP, you can give specific samples a "Historical" status by placing your mouse over the sample location while in Map View and, in the dialog that comes up, checking the Historical box.
Besides using the Copy button in the Data Entry sub-page and
pasting into a program outside of VSP, there is another method of exporting
sampling locations. To export sampling locations to a text
file (for example, to use the coordinates in a ground penetrating radar system),
1. Select the Sample Area as described above and develop the sampling design as described in Section 3.
2. Choose Main Menu option Map > Sample Points > Export. Provide a name for the text file and click Save.
This option is best explained with an example:
1. Start VSP and open a new project using Main Menu option File > New Project
2. Open the Millsite.dxf file using Main Menu option Map > Load Map from File.
3. Click the New Area button on the toolbar and, after choosing
a color, select the large ellipse by  right
clicking inside the oval. If you accidentally get some other
area, click the Remove Areas button and start over. Place
the cursor as far from other objects as possible but still inside the
ellipse.
right
clicking inside the oval. If you accidentally get some other
area, click the Remove Areas button and start over. Place
the cursor as far from other objects as possible but still inside the
ellipse.
 4. Choose the Main Menu; select
Sampling Goals > Compare Average to Fixed Threshold > Data not
required to be normally distributed > Ordinary sampling of symmetric
distribution. Click the Apply button to place samples in
the Sample Area. You should now have a Sample Area with 24
sampling locations similar to that shown in Figure 2.36.
4. Choose the Main Menu; select
Sampling Goals > Compare Average to Fixed Threshold > Data not
required to be normally distributed > Ordinary sampling of symmetric
distribution. Click the Apply button to place samples in
the Sample Area. You should now have a Sample Area with 24
sampling locations similar to that shown in Figure 2.36.
5. Using the Main Menu option Map > Sample Points > Export, save all the sampling locations to a text file named Points.txt.
6. Now we are ready to remove some of the sampling locations. First, delete the first 16 rows (sampling locations) from file Points.txt using a text editor like Notepad. Save the remaining 5 rows to a new file named Remove.txt. These are the locations that will be removed from the Sample Area.
7. Finally, to remove the sampling locations listed in Remove.txt from the Sample Area, choose Main Menu option Map > Sample Points > Remove. Select the file Remove.txt and click the Open button. You will see in Figure 2.37 there now are only 16 sample points instead of the original 24 shown in Figure 2.36.
In other words, the coordinates in the Remove.txt file are the sampling locations that are deleted from the Sample Area. Just one location or all the locations can be removed.
The current version of VSP has the ability to draw and apply sampling designs to rooms and hence, buildings. Rooms have height, spatial relationships with other rooms (i.e., can be assigned to floors within buildings), and a unique set of objects associated with them (e.g., doors, windows, and surface overlays). They also have a unique set of parameters that are VSP-assigned (e.g., volume, floors, ceilings, walls) and user-assigned (e.g., zones, class, HVAC system, release point of threat agent, etc.).
At the most basic level, a Room is just an enclosed Sample Area with height greater than zero. As such, many of the VSP functions and screens associated with Sample Areas are the same for Rooms. However, there are also many VSP functions used exclusively for Rooms.
A Building is a collection of rooms. A Building is input into VSP by loading a .dxf map file. To place multiple floors of buildings in a VSP project: load each floor from a separate .dxf file, giving each file a different z-offset when loading. Rooms, stairways, and elevators within the building upon which you wish to place samples need to be defined to VSP by using the Room > Delineate Rooms function. Alternatively, simply a create sample area that follows the outline of a room or a stairwell on the CAD drawing (i.e., a floor plan .dxf file) to define room shape and size (see section 2.3.1.1, corner selection method) and then change the room height to a value greater than 0. See Chapter 6 Room Features in VSP for more information.
For help during this section, please refer to this page in the Quick Start Guide: Drawing a room.
Start a new project using Main Menu option File > New Project. Click the Draw Room button on the Room Toolbar or select Main Menu option Room > Draw. (Use View / Room Toolbar to show the Room Toolbar.) A tooltip box displays the three ways to draw a room using this tool:
Enter the room dimensions on the keyboard: LxWxH. (e.g., 12x10x8 )
Enter the corners of the room on the keyboard: X, Y (e.g., 50, 50 90,90 ).
Left-click the mouse at the upper-left hand corner of the room, and drag the mouse to the lower-right hand corner. Left-click the mouse to finish the room. This is similar to drawing a rectangle, except that VSP automatically sets a wall height of 8 ft. Room height can be changed using Main Menu item Room > Set Room Height or by clicking on the Set Height button on the drawing toolbar.
With the room displayed, right-click anywhere within the room. The Sample Area Information dialog box appears (Figure 2.38).
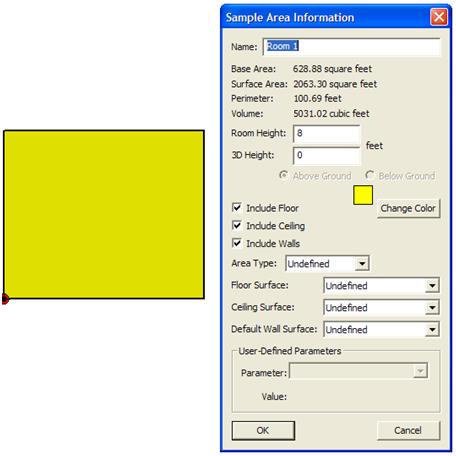
Figure 2.38 Sample Area Information Dialog Box for a Room
This dialog box can be used to view parameters of the room such as base and room area, perimeter, and volume. The name of the room is set to "Room n" until changed by the user. The user can set and change other parameters such as room height, color, whether the floor and ceiling are included as part of the room (and hence samples will be applied to the floor and ceiling as well as the room walls). Any User-Defined Parameters set will be displayed in the pull-down list. User-Defined Parameters for Rooms are set in the same way as User-Defined Parameters for Sample Areas (see Section 2.3.4). Note that you are in Map View when drawing the room.
The room can be modified in the Map View by inserting a point(s) into a wall and then moving the wall section (see Figure 2.39). This is used to create L-shaped rooms, or irregular-shaped rooms.
Use Map > Insert Point and click on one edge of the room. Hold down the Shift key and left-click on the segment to select it. Now move the segment out from the room by dragging it with the mouse (move while holding down the left-mouse button). It is helpful to hold down the Ctrl key while dragging the section to keep it aligned straight.
You can set the exact length of a line segment by right-clicking on it. First select the segment (hold the Shift key while clicking between two points on the map), then right-click on the selected segment. A dialog will appear that allows you to enter the exact length of the line segment. If the segment is attached to other segments at right angles, those other segments are moved or adjusted as well.
After the room is drawn (defined), it becomes the current room and can be displayed with Room view (View > Room). The current room is indicated on the map by a thick black outline and a darker shade. A room can be displayed in one of three view formats:
Perspective
Wall Strip
Splayed
The display view format can be selected using one of the three buttons on the drawing toolbar, or by selecting one of the formats under the Main Menu item Room while in Room view. Figure 2.40 shows the three views of a room.
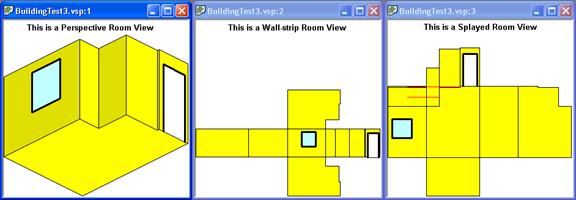
Figure 2.40 Three Perspective Views of a Room
When rooms are defined using pictures or existing maps, the Delineate Rooms (Main Menu item Room > Delineate Rooms) mode allows the user to create rooms at right angles inside existing map shapes. Delineate Rooms is an on/off toggle switch. While in this mode (you must be in Map View), you can fill up the space inside an irregular-shaped area with individual rectangles. For more information on this tool, consult Help > Help Topics (Contents) > Menus > Room> Delineate Rooms.
The delineate tool is meant to be used with imported maps and not with rooms drawn with the room drawing tool. If the delineate tool is used with rooms drawn with Room > Draw, and rooms are combined to form irregular shapes (see Section 6.1.3), there may be multiple rooms selected. You can look at the Sample Areas on the Layer Control bar to help determine if you have overlapping rooms.
Figure 2.41 is an imported CAD drawing of a floor layout with individual rooms delineated using the VSP Delineate Rooms tool. It shows the Map View of the room with Room Information displayed (right-click anywhere within the room to display information box). We also used the Main Menu item Room > Insert Annotation to put the label "Selected Room" on the map. Figure 2.42 is a Room View of the same room with Perspective View selected.
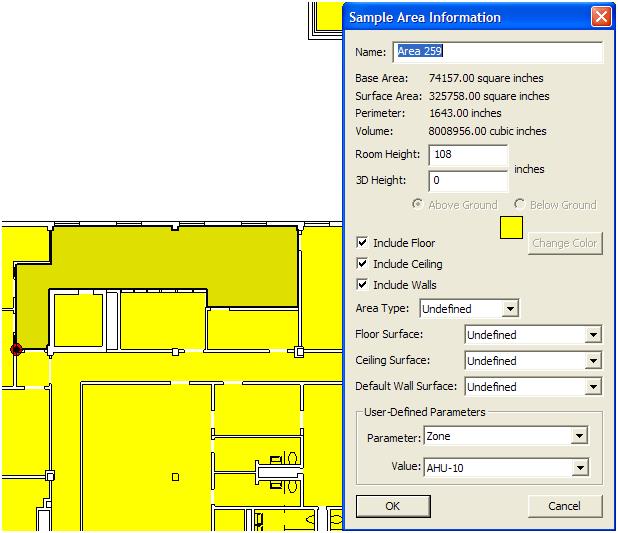
Figure 2.41 Room in Map View
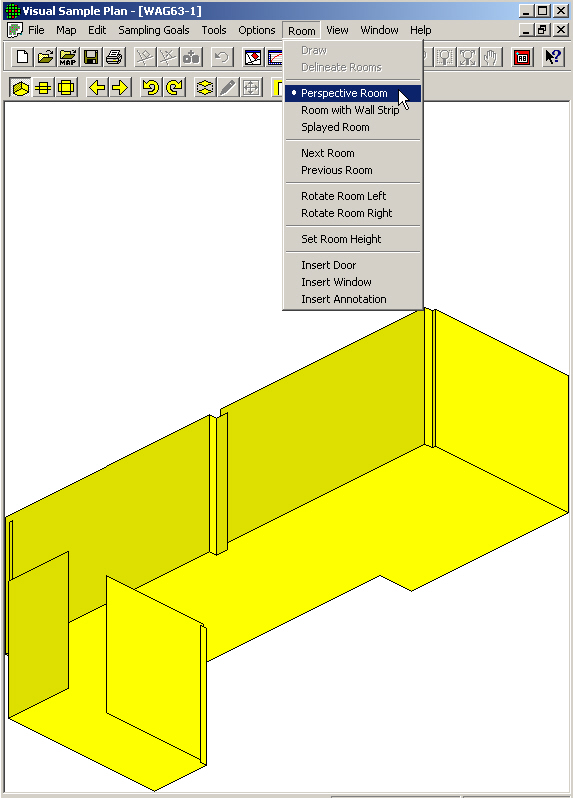
Figure 2.42 Room in Room View
VSP has two objects associated with rooms: doors and windows. There are two ways to view these objects: in Map View (see Figure 2.43) and in Room View (see Figure 2.44). Figure 2.44 is another section of the CAD drawing shown in Figure 2.42. A door in the CAD drawing was defined for VSP. Right-clicking on the Map where the arrow is pointing brings up the Object Information dialog box for the Door Object at that location.
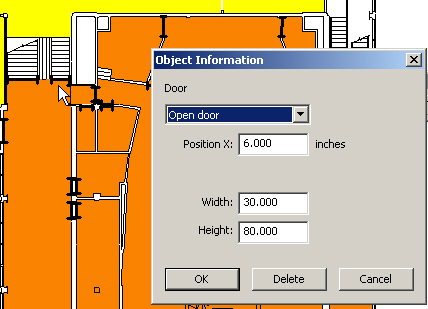
Figure 2.43 Door Object Displayed Using Map View
Doors and windows can be added in Room View using Main Menu item Room > Insert Door/Window or by clicking on the door or window button on the Room Toolbar. Once added, the properties of the room objects can be viewed by right-clicking on the object, which brings up the Object Information dialog box. This is shown for a door in Figure 2.44 and for a window in Figure 2.45.
Note that VSP also has the capability to place a polygon on top of a surface with a different surface type. The polygons are called "Surface Overlays". Surface overlays can be elevated above the floor to represent the top of furniture, such as a table top. Surface overlays are covered in section 6.3.4.
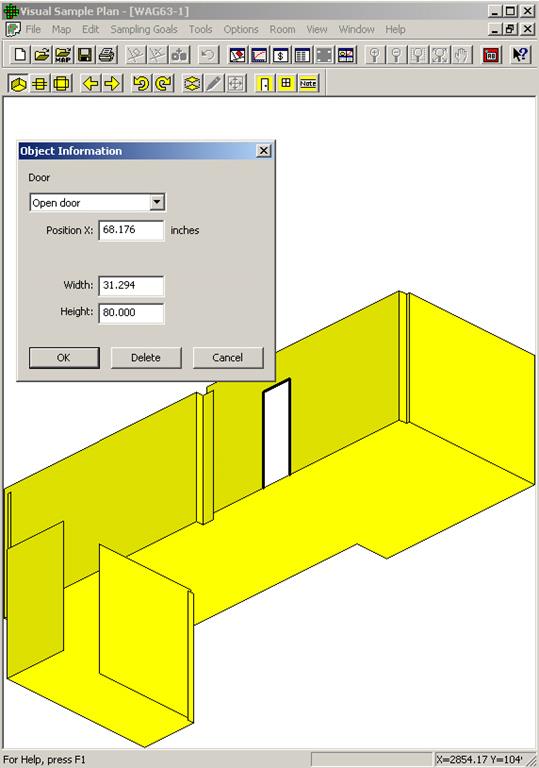
Figure 2.44 Door Room Object with Object Information Dialog Box Displayed
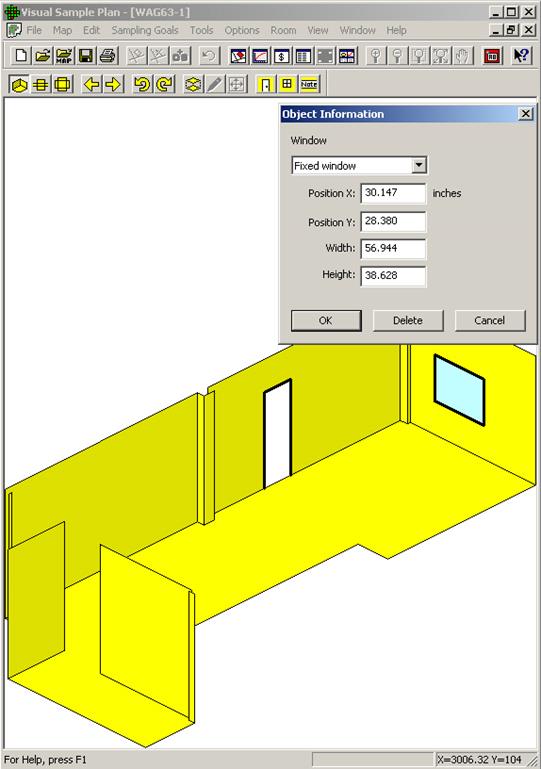
Figure 2.45 Window Room Object with Object Information Dialog Box Displayed
Rooms can have VSP-defined parameters (e.g., Area, Perimeter, Volume, Name) and User-Defined Parameters (e.g., Zone, Class). The User-Defined Parameters are set in the Sample Area Information dialog box or with the Main Menu item Edit > Sample Areas > Set Parameter Values. This second option is a very powerful tool. Figure 2.41 shows that the room named "Area 259" is in Zone "AHU-10" (i.e., Air Handling Unit 10). All the rooms on AHU 10 are assigned to the same Zone so they are easily identifiable. In another example, rooms that exceed a release criteria could have a logical (yes/no) parameter assigned called "Contaminated", and coded red/green. Note that once a room parameter is set up using Main Menu item Edit > Sample Areas > User-defined Parameters, all rooms are given a default value for that parameter. Section 2.3.4 discusses Sample Area Parameters, which also applies to Rooms.
Rooms can be colored automatically based on the value of one of the built-in or user-defined parameters. Once rooms have been defined to VSP, choosing the menu item Edit > Sample Areas > Color by Value displays the dialog shown in Figure 2.46. This dialog allows you to choose one of the predefined gradient or discrete color sets and one of the sample area parameters. Certain parameters can also be colored by the logarithm of the value. This dialog also allows the Color by Value function to be turned off or on. Use the Help button on the toolbar to find out more information on this tool.
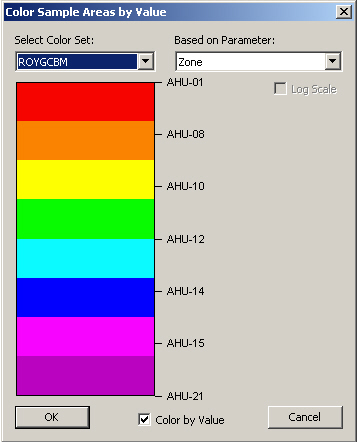
Figure 2.46 Dialog Box for Color Sample Areas by Value
Clicking the button for Next Room from the Room Toolbar, or selecting Room > Next Room from the Main Menu changes the current room to the next selected room on the map. The current room is indicated by a thick black border and is a slightly darker hue in color-coded rooms. Previous Room changes the current room to the previously selected room on the map. The order of room selection is the order of creation. Note that the order for room and sample areas can be changed by the menu command Edit / Sample Areas / Bring to Front.
Clicking the button for Rotate Room Right from the Room Toolbar, or selecting Room > Rotate Room Right from the Main Menu rotates the Perspective or Wall-Strip Room View clockwise 90 degrees. Rotate Room Left rotates the Perspective or Wall-Strip Room View counter-clockwise 90 degrees.
For help during this section, please refer to the VSP Help Topic Create Surface Overlays or to the Quick-Start Guide's help page for this topic.
One or more surface overlays can be inserted in a room to represent a portion of a surface that needs to be distinguished from the overall surface. For example, a portion of the floor in a room may be covered with tile while most of the floor is covered with carpet, requiring a different sampling technique. A surface overlay can be elevated from the floor to represent the top horizontal surface of a desk, chair, cabinet, or shelf. Surface overlays can be placed on any surface in the room. Only floor overlays can be elevated.
When starting a VSP project, the only surface type available is 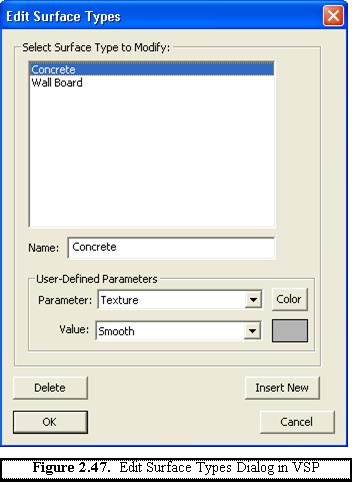 the default "undefined" surface
type. To define additional surface types, select Edit >
Surfaces > Surface Type to bring up the Edit Surface
Types dialog (Figure 2.47). This dialog is used
to define different surface types that can be assigned to the surfaces
(floor, ceiling, walls, etc.) inside a room or to surface overlays. Click
on an existing surface type to change the name or select different User-Defined
Parameters, or to add a new surface type, click Insert New.
the default "undefined" surface
type. To define additional surface types, select Edit >
Surfaces > Surface Type to bring up the Edit Surface
Types dialog (Figure 2.47). This dialog is used
to define different surface types that can be assigned to the surfaces
(floor, ceiling, walls, etc.) inside a room or to surface overlays. Click
on an existing surface type to change the name or select different User-Defined
Parameters, or to add a new surface type, click Insert New.
To create a surface overlay, select Edit > Surfaces > Create Surface Overlays. This allows you to create a small patch on an existing surface (floor, wall, etc.) that can be distinguished from the room surface on which it is located. See Section 6.3.4 for more information on surface overlays.
No matter how you imported or created a site map or Sample Area for VSP, you can always save the information in VSP's own file format. From the Main Menu, select File > Save Project As and provide a name for the project. VSP will add the VSP file extension automatically. Alternatively, you can use the Save button with the disk icon on the VSP toolbar. After you have created a sampling design as discussed later in this guide, saving your project as a VSP file also will save the input data, cost data, and recommended sample sizes.
There are several ways to get Help in VSP:
Select Help from the top bar of Menu items for help on the Expert Mentor (section 2.9.1) or to view Help Topics by Contents, Index, and Search.
Select the Help button on the main toolbar (button to the far right labeled "?") and click on any pull-down menu item or other feature on the VSP screen. The Help Topic for that menu selection will be displayed.
Help button at the bottom of some Dialog Boxes and Input and Output Screens. The Help brings up a new screen that contains a technical discussion of the tests, algorithms, and calculations used by VSP to perform the functions referred to on the Input and Output Screens.
VSP is user-friendly and most users find they can run VSP from the guidance and information presented in the various Help functions in VSP.
The Expert Mentor dialog provides guidance, recommendations, and warnings to the VSP user to:
Help prevent inadvertent misuse of VSP
Help the user understand how VSP works
Help ensure the number and location of samples obtained using VSP are appropriate
To activate the Expert Mentor, select Help > Expert Mentor. Figure 2.48 shows the Expert Mentor dialog.
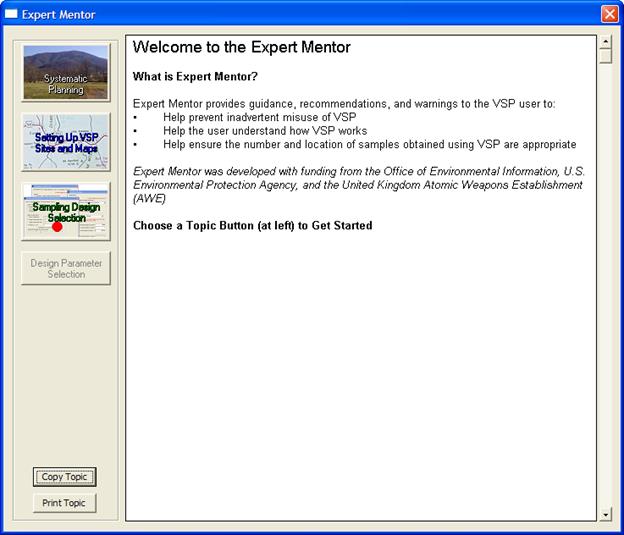
Figure 2.48 Expert Mentor dialog
On the left-hand side of the dialog in Figure 2.48, there are four major Expert Mentor modules. As of VSP version 6.0, three of these modules are implemented in VSP, Systematic Planning, Setting Up VSP Sites and Maps, and Sampling Design Selection. To select a module, click on it. These are briefly discussed in Sections 2.9.1.1-3. For an in-depth tutorial, refer to the actual modules themselves. The other module, Design Parameter Selection, is planned and currently in development.
Systematic Planning is a process based on the scientific method to ensure that the level of effort in planning is sufficient to assurance that environmental data collected will be adequate for their intended use.
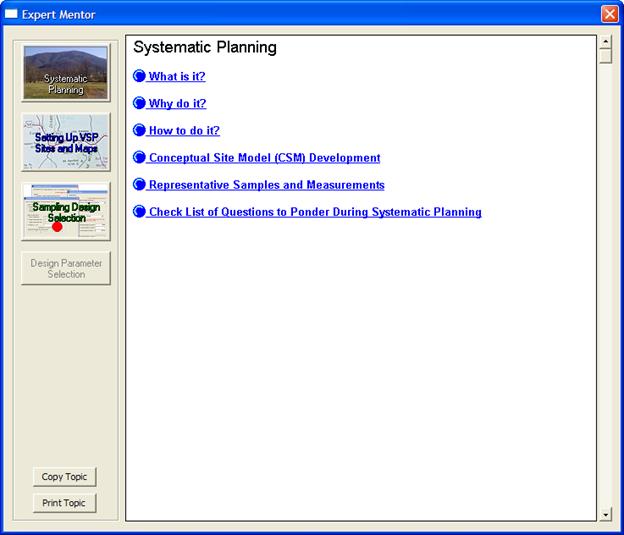
Figure 2.49 Systematic Planning dialog
The dialog for Systematic Planning is shown in Figure 2.49. A number of tutorials can be accessed by clicking on them. These are briefly described below. Note that within each of these topics there are also one too many subtopics which provide additional information and tutorials. To access these subtopics, use the Systematic Planning module in the Expert Mentor.
What is it? This explains what systematic planning is.
Why do it? This provides guidance on avoiding bad data, balancing resources and decision uncertainty, avoiding waste by thinking through why, what, how, and when, assuring VSP is not misused, avoiding bad or inappropriate data, getting the right amount of representative data, and using the right statistic.
How to do it? This describes the DQO (Data Quality Objectives) process and the Triad Approach for modernizing and streamlining sampling, analysis, and data management.
Conceptual Site Model (CSM) Development. Explains how to use a Conceptual Site Model that describes what is known about the site.
Representative Samples and Measurements. Explains what Representative Samples and Measurements are, why they are important, and how to achieve them.
Check List of Questions to Ponder During Systematic Planning. Provides a list of questions to go through to assist in the planning process.
This module explains the process of loading, drawing, and setting up Maps in VSP. The Setting Up VSP Sites and Maps dialog is shown in Figure 2.50. The sections shown in Figure 2.50 are explained below.
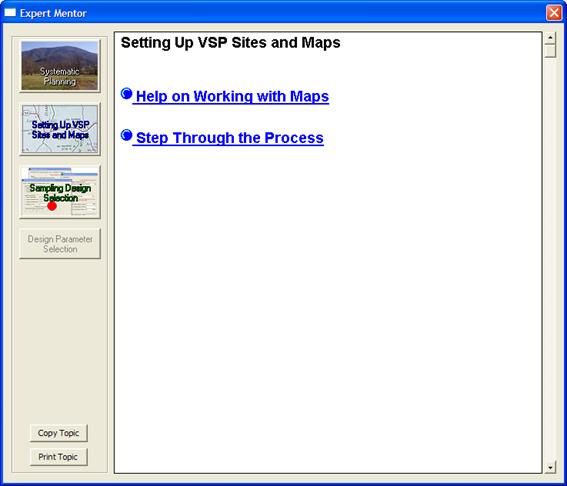
Figure 2.50 Setting up VSP Sites and Maps dialog
Help on Working with Maps. This section explains a number of topics on how to work with maps. Topics include an overview, objects in VSP maps, loading maps from a file, creating a map by drawing, creating a map from coordinates, editing a map, editing a sample area, navigating the map, working with background pictures, and topics on miscellaneous tools, tips, tricks, and traps.
Step Through the Process. This section allows you to step through the process of setting up a site in VSP in a systematic fashion. Clicking on the links actually performs or initiates the actions within VSP. Topics include starting with a blank project, loading and drawing maps, setting map units, creating a sample area, and loading a background picture.
The Sampling Design Selection dialog asks the user a series of questions in order to point them to the relevant module(s) to use based on their answers. The first screen (Figure 2.51) is a list of "needs" where you check all that apply. The subsequent screens ask you about the assumptions you are making about the data to be collected. When the needs and assumptions have been defined, Expert Mentor lists the VSP modules which are relevant given those needs and assumptions.
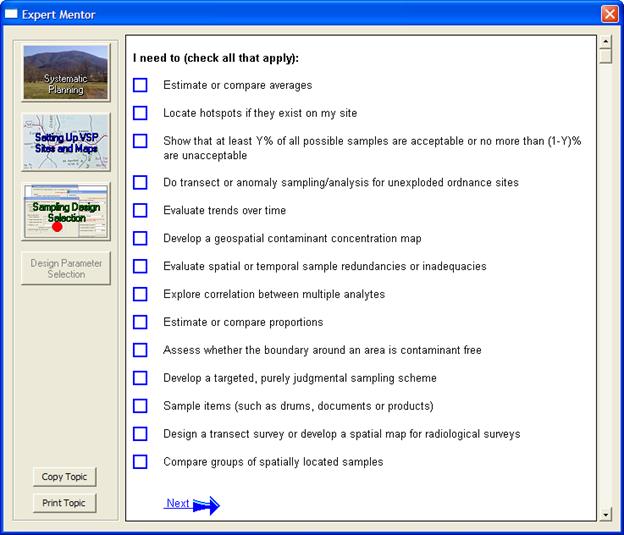
Figure 2.51 Systematic Planning First Screen