The transect (swath) sampling plans laid out by VSP are perfect straight lines that are spaced at regular intervals. However, when field crews implement a VSP sampling plan, they may find that obstacles, dense vegetation, geographic features and other factors that make it undesirable, difficult or impossible to follow straight lines with the geophysical sensors.
VSP can be used to approximate the probability that a target area of specified size and shape would have been traversed and detected by any given set of transects. The first type of transects that can be used for this analysis are regular transects (described in the paragraph above). A set of regular transects can be generated by VSP using the Find Transect Spacing Design and then this dialog can be used to simulate how the design performs in traversing a given target area.
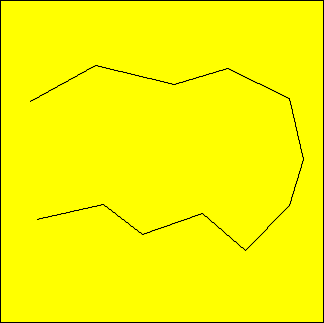
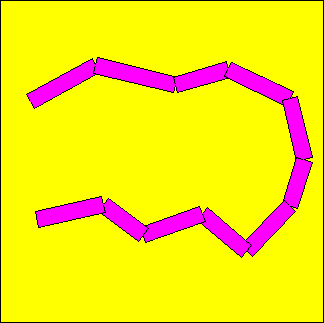
Transects used in the field are defined as a series of connected points (see figure above, left). These connected points would probably be captured by a logging global positioning system (GPS). In reality, transects have a width reflecting the width of the detection equipment as it traverses the ground. The transects therefore can be represented as a series of connected rectangles rather than as a series of connected line segments (see figure above, right). VSP refers to these types of transects as meandering transects. Transect data can be imported as course-over-ground (COG) data into the UXO data page of one of the other UXO designs.
The probability of traversing an elliptical or circular target area with a meandering transect is approximated by the probability of the target intersecting one or more of the transect rectangles. It is an approximation because there is no compensation for the gaps between and overlapping areas of the rectangles. Rather than try to deterministically calculate the probability of traversing, VSP uses a Monte-Carlo method for simulating the probability of traversing (hitting) the target.
The simulation uses these parameters:
\(n\): Number of trials
\(r\): Radius of target (semi-major axis for ellipses)
\(s\): Shape of target (height to width ratio)
\(\theta\): Orientation of target area with respect to the x-axis (random or a set angle)
When the Target Traversal Simulate button is pushed, VSP throws down the \(n\) trial target areas and counts the number that touch one of the transect segments. A hit occurs when a trial target area touches a transect segment. The probability of traversing is computed as the number of hits divided by the number of trial targets. This probability is displayed as a percentage. For technical details of how the algorithm works, refer to the document Version 2.0 Visual Sample Plan (VSP): UXO Module Code Verification (Gilbert et al. 2003).
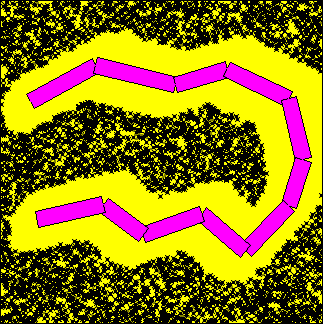
If the Place samples on map to show simulation check-box is selected, VSP places a point on the map where any trial target area was not traversed. The figure below shows the results of using the shown meandering path to try to traverse a target of shape \(s\) = 0.5 and angle \(\theta\) = 45˚. The dark area in the figure is the dense cluster of locations where target areas could exist without being traversed by any portion of the meandering path. All targets in the clear (yellow) area would be traversed by one or more meandering transect segment.
The assumptions associated with the transect spacing algorithm are that:
1. The target area (its projection onto the coordinate plane) is circular or elliptical.
2. The meandering transects can be represented as a series of connected rectangles.
Gilbert, R.O., B.A. Pulsipher, D.K. Carlson, R.F. OBrien, J.E. Wilson, D.J. Bates and G.A. Sandness. 2001. Designing UXO Sensor Surveys for Decision Making, Pacific Northwest National Laboratory, Richland, WA.
Gilbert, R.O., J.E. Wilson, R.F. OBrien, D.K. Carlson, B.A. Pulsipher and D.J. Bates. 2003. Version 2.0 Visual Sample Plan (VSP): UXO Module Code Verification, Pacific Northwest National Laboratory, Richland, WA.
Place samples on map to show simulation
Target Traversal Simulate Button