Use this command to change the current window to a Coordinate view.
Shortcuts
Toolbar: ![]()
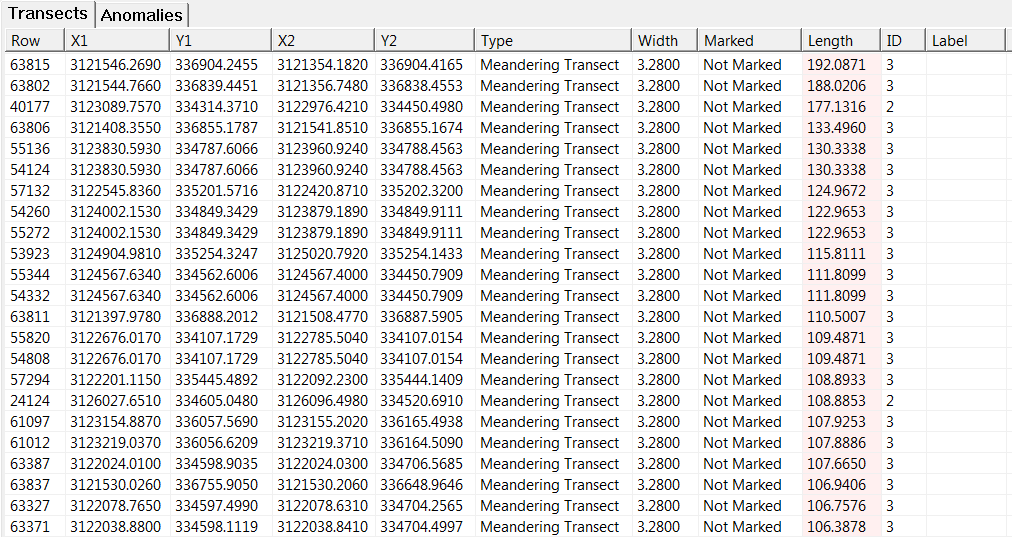
The Coordinate View shows attributes of the sampling locations. When working with Unexploded Ordnance (UXO) data, it displays information about transects and anomalies. When the project contains building footprints, it also contains information about sampling locations for each building footprint.
The Coordinates View contains one or more Tab controls: one for each type of data in the project. The example above has two tabs - one for Transects data and one for Anomalies data. Click the tab label to view the other types of data (if available).
The grid has a row for each sample location and a column for each attribute. Some data items can be edited, some are read-only.
By default, the data is sorted by ascending row number. Click on a column header to sort by a different column. Click on the column header again to change the sort direction. Columns that are in ascending order are shaded light green. Columns that are in descending order are shaded light red. In the example above, the transects are sorted by descending Length.
To adjust column widths, position the mouse over the dividing line between column headers. Hold the mouse button down while moving left or right. Release the mouse button to set the width.
Column widths and column sorting information is saved with the project file.
Coordinate View data can be copied to and pasted from the Clipboard as tab-delimited text using Edit / Copy or Edit / Paste from the menu. It can also be printed using File / Print.
Helpful Hint: Clicking on an item in the grid displays the properties for the row's object in the Property bar. From there you can use the Highlight on Map feature to see the location of the object in the Map View.