Visual Sample Plan (VSP) is a software tool for selecting the right number and location of environmental samples so that the results of statistical tests performed on the data collected via the sampling plan have the required confidence for decision making. Thousands of users from all over the world and from every U.S. state have registered a downloaded copy of VSP, and hundreds of people have attended VSP training classes. Users include employees of the federal government, state and local governments, and private industry. Sponsors of this public domain software include the U.S. Environmental Protection Agency (EPA), U.S. Department of Energy (DOE), U.S. Department of Defense (DOD), U.S. Department of Homeland Security (DHS), National Institute for Occupational Safety and Health (NIOSH) within the Centers for Disease Control and Prevention (CDC), and the U.K. Atomic Weapons Establishment (AWE).
VSP provides sample designs and sample-size equations needed by specific statistical tests appropriate for several types of environmental problems. Table 1.1 is a list of the sampling goals that can be addressed in the version 6.0 of VSP.
Table 1.1 . List of Sampling Goals
Sampling Goal |
User's Guide Section |
Compare Average to Fixed Threshold |
|
Compare Average to Reference Average |
|
Estimate the Mean |
|
Construct Confidence Interval on Mean |
|
Locate Hot Spots |
|
Show that at least some high % of the sampling area is acceptable |
|
Combined Average and Individual Measurement Criteria |
|
Detect a Trend |
|
Identify Sampling Redundancy |
|
Compare Proportion to Fixed Threshold |
|
Compare Proportion to Reference Proportion |
|
Estimate the Proportion |
|
Establish Boundary of Contamination |
|
Find UXO Target Areas |
|
Post Remediation Verification Sampling (UXO) |
|
Sampling within a Building |
|
Radiological Transect Surveying |
|
Item Sampling |
|
Non-statistical sampling approach |
VSP is easy to use, highly visual, and graphical. It has extensive online help and tutorial guides. Reports produced by VSP can be pasted directly into a quality assurance project plan, test plan, or sampling and analysis plan. VSP can be used to implement EPA's systematic planning process (EPA 2000a) for a variety of problems: selection between clearly defined alternatives [Step 7 of the Data Quality Objectives (DQO) process], studies where a confidence interval on an estimated parameter is needed, or determination of whether a hot spot or target exists. The user specifies the criteria for "how good" the answer has to be (Step 6 of the DQO Process), and VSP uses this as input to the formula for calculating the required sample size. VSP is unique in this regard.
VSP is designed primarily for project managers and users who are not statistical experts, although those individuals with statistical expertise also will find the software very useful.
For detailed documentation of what VSP is, please refer to the VSP Help Topic What is VSP.
VSP 6.0 is a major new release of the software. Features new since version 5.0 include:
Sampling Designs
For Trend Designs - Added the following: (1) new Graph Types, (2) support for Well Grouping to Data Analysis, including graphs, tests and summary statistics, (3) Confidence Intervals and Prediction Intervals to time series plots, (4) Comparison Test to predicted values, (5) beta version of design to account for Exogenous Variables in Trends (variation of Multiple-Regression / ANOVA Modeling ), (6) Comparison to Predicted Values on time series plots, (7) Season and Location Tests for Homogeneity , (8) support for multiple analytes to plots, (9) Non-Detect support for Mann-Kendall and Seasonal-Kendall tests for trends, (10) Outlier Test. Made improvements to several plots. Some display issues were corrected for the Graph View of some designs.
For UXO Designs -Added the following: (1) option for indicator kriging to truncate imported estimates to be between [0,1] for geostatistical mapping, (2) added testing of indicator kriging threshold for geostatistical mapping to ensure that the threshold is within the density values, (3) a new geostatistical mapping option to Delineate High Density Areas , which automatically delineates high density areas from either kriged data or from target markers, or to manually define high density areas, (4) Color-Coded Histograms to display which high density areas contributed to anomaly density distributions, (5) Side-by-Side Box Plots for displaying density distributions of high density areas, (6) option to select a specific area of a map for displaying an anomaly density histogram, (7) line simplification support when importing course-over-ground data, (8) Import from / Export to Geosoft (UXO project data in a single text file), (9) anomaly filtering for UXO find targets design. Resized dialog of Geostatistical Mapping of UXO Density for better display at various screen resolutions. Improved Transect Compliance Sampling design for UXO (new design uses cleanup grids and equal length transects). Improved interface with KT3D to avoid memory errors. Made improvements to GAMV function.
For Combined Judgment Random Designs - Made improvements to mathematical implementation of underling model.
For Multi-Increment Sampling Designs - Added the following: (1) multi-increment sampling to the Compare Average to Reference Average and Construct Confidence Interval on a Mean designs, (2) grouped placement of increments, (3) help files and report generators for multi-increment sampling. Improved systematic placement of increment samples.
For Locate Hot Spots Designs - Added the capability to augment an existing design with additional samples Using existing locations to ensure that a hotspot of a desired size will be detected.
Added Item Sampling , which includes a new conversational style design interface. Added the following: (1) reports, (2) support for picking judgment items for combined judgment random item design, (3) editable labels to items. Improved Coordinate View display for items.
Added Radiological Transect Surveying designs which builds upon the methodologies developed for the UXO designs. Designs include: (1) Transect spacing needed to locate a hot spot , which computes the transect spacing needed to traverse a hot spot of a specified size and shape, (2) Locate and mark hot spots , which locates hot areas from survey data, and contains tools for automatically or manually delineating hot areas and providing statistics for those areas, (3) Geostatistical analysis , which uses kriging to locate hot areas from survey data, and contains tools for automatically or manually delineating hot areas and providing statistics for those areas, (4) Post-survey probability of sampling in a hot spot , which uses a monte-carlo simulation to determine the probability that a particular survey pattern would traverse a hot spot of a specified size, shape, and orientation. All designs include on-line help and report generators.
Added ability to calculate confidence or percent clean given number of samples for Acceptance Sampling, Compliance Sampling and Non-Parametric UTL designs. Added ability to calculate the fraction less than action level given number of samples for Non-Parametric UTL design.
Added Analyze Sampling Redundancy which includes options to Analyze Spatial Redundancy and Analyze Temporal Redundancy .
Combined all the Presence/Absence designs into a single dialog.
Updated Stratified Sampling design.
Updated Sequential Sampling design.
Added Two-Sample t DQA test.
Moved Mean vs. Fixed designs to all-in-one, sentence-based dialog.
Moved Mean vs. Reference designs to all-in-one, sentence-based dialog.
Building Features
Added the following: (1) blocking of cell samples on walls behind elevated surfaces, (2) popup menu that includes access to dialog for selecting a different current room. Improved the control over Surface Overlays, blocking of samples behind elevated surfaces. Added Z-Offset to map import which facilitates multiple floors in a single building design.
Maps
Added the following: (1) Well Grouping options to use with Trend Designs, (2) allow UTM Conversion to output feet as well as meters for Lat / Long maps (SHP files), (3) option to draw a circle by entering a radius and then a center point, (4) color legends for sample areas when colored by value, (5) display of sample and sample area information on status bar when mousing over, (6) support for using Font Symbols as sample location markers on a map, (7) UTM Conversion support to Load World File function, (7) ability to Export World File , (8) Map Layer Control Bar which supports layers on Map View, (9) support for layers when loading DXF file, (10) Google Earth Calibration , (10) Properties Bar which supports Sample Areas and Samples and support for Z-Offset when loading map files. Made improvements to: (1) Combine Areas , (2) rotating sample areas, (3) Layer Control, (4) Sample Area Uncombine.
User Interface
Redesigned Data Entry page and data import process for many modules. The new design enables users to specify mappings on the fly to provide maximum flexibility to import tabular data.
Miscellaneous
The Expert Mentor now supports Sampling Design Selection guidance and has been updated.
The Analyte Correlation tool has added a Pairs Plot , tool tips when mousing over data points on correlation plots, and a custom confidence interval.
Added beta version of Multiple Regression / ANOVA Modeling tool.
Updated several reports to handle multiple analytes.
Made Improvements to currency symbol support, allowing user to override system settings.
Added Group Comparison Tool using Analysis of Variance (ANOVA) and Kruskal-Wallis tests.
Added Probability and Uncertainty Maps to geostatistical analysis tool.
Added a Multi-Gaussian check feature to the geostatistical analysis tool.
Made Quasi-Random sampling Option the default.
Probability and Uncertainty mapping added to Geostatistical Analysis.
Added TIFF and GeoTIFF picture support.
Improvements to various help files and report generators.
Improvements to Historical sampling support.
VSP 6.0 runs on Microsoft Windows operating systems (Windows 7, Vista, XP, CE, Millennium Edition, 2000, NT, and 98.). Windows 7 and Vista users who have trouble starting VSP or running VSP Help topics should visit http://vsp.pnl.gov/win_vista.stm for instructions. VSP will not run on Windows 95 or earlier Windows operating systems. VSP currently does not run on Macintosh® or UNIX®/Linux systems. Any personal computer with sufficient hardware to run one of the supported operating systems should run VSP. The minimum hardware recommended is
1 GHz processor
256 MB RAM
50 MB of free space on the hard drive
The current version of the VSP setup file is available from http://vsp.pnl.gov/ . After the setup file is downloaded, installation of VSP is almost automatic. Simply run the VSP setup file, VSP60.exe (or later version), and follow the on-screen instructions. The VSP program and auxiliary files will be copied by default to the C:Program FilesVisual Sample Plan folder (subdirectory). However, you may specify a different location for the files.
Once installation is complete, you will start VSP using option Start > Program Files > Visual Sample Plan > Visual Sample Plan. Alternatively, you may place a VSP shortcut on the desktop by selecting New > Shortcut from the menu obtained by right-clicking the mouse on the desktop. The appropriate command line for the default folder is
"C:Program FilesVisual Sample PlanVSample.exe".
VSP may be uninstalled using the Control Panel icon labeled Add/Remove Programs. You may access this option using the Start button and Control Panel.
New versions of VSP are often released as prototypes for testing. These demonstration versions have expiration dates. After the expiration date has passed, you will be given the option of continuing with the current version or going to the VSP website to download the latest version. Version 6.0 is not a demonstration version and does not have an expiration date.
Sampling is the process of gaining information about a population from a portion of that population called a sample. A key goal of sampling design is to specify the sample size (number of samples) and sampling locations that will provide reliable information for a specific objective (called the Sampling Goal) at the least cost. VSP does the required calculations for sample size and sample location and outputs a sampling design that can be displayed in multiple formats. VSP does not address sample collection methods. It assumes the sample support (amount of material in the sample) is sufficient and the sample is representative of the population. A few designs in VSP assume the sample is taken across an entire grid (say a 10 x 10 cm swipe), but most designs assume the sample is a point sample taken at an X,Y coordinate location, and has sufficient volume for measurement and testing. For appropriate sampling goals, VSP addresses the trade-off between repeated analytical measurements on a single sample to reduce overall sample result variability (measurement quality objectives / MQOs) and provides a sensitivity table for comparing analytical methods of varying accuracy and cost.
VSP can be used to develop a new sampling design. It can also be used to compare alternative designs. VSP automates the mechanical details of calculating sample size, specifying random sampling locations, and comparing sample costs with decision error rates. These activities can be accomplished in the context of your own site map displayed onscreen with various sampling plans overlain on sample areas that you select.
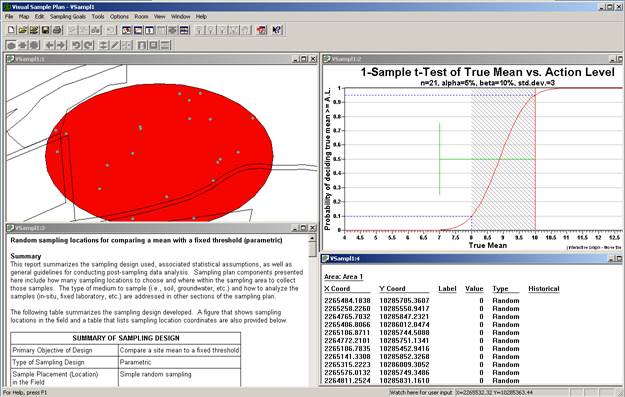
The first thing you will do after opening the program is to import or construct a visual map of the study site. Next, you select the area or areas to be sampled. The Sample Area may be only a portion of the study site (see the elliptical sample area in Figure 1.1, upper left window).
Then, for the Sampling Goal that you select, VSP will lead you through the quantitative steps of the DQO process (Steps 6 and 7, (EPA 2000a)) so that the program has the information needed to compute the recommended minimum number of samples (sample size). You can enter sampling costs and test alternative designs against a fixed budget.
The locations of the samples over the Sample Area are determined by the specific sampling design (pattern) that you select. For some Sampling Goals, and for some assumptions about the population, only certain designs are allowed from a statistical theory perspective. For example, sequential sampling is appropriate only for the sampling goal of Compare Average to a Fixed Threshold when the population units can be assumed to be distributed normally. When there is a choice of designs, VSP displays a selector for the allowable designs.
VSP can be used for designing samples for environmental settings as well as building/room/surface settings. For environmental settings, site maps and aerial pictures can be loaded into VSP for sample placement. For buildings and rooms, a CAD drawing or floor plan are loaded. Map View displays samples placed on maps and room drawings. On a site map, VSP displays the sample locations for easy visualization (see Figure 1.1 , upper left window). VSP also lists the geographical coordinates of the sample locations (see Figure 1.1 , lower right corner), which can be saved and exported as a Drawing Exchange Format (DXF) or SHP file for use in a geographical information system (GIS) or saved as a text file for use in global positioning system (GPS) software.
Several additional output formats for the design created in VSP are available: a Graph View of the design (see Figure 1.1 , upper right window), a Report View (see Figure 1.1 , lower left window), a Room View, and a 3D view. The Graph View displays either a Decision Performance Goal Diagram for Sampling Goals that involved selecting between alternative actions, or a performance graph comparing number of samples to a design parameter for the other classes of sampling goals. Some designs do not have a Graph View. The Report View is a text report that describes the sampling design in detail. The report contains the input values, the assumptions, the cost of the design, VSP output, technical description of the sample size formula and algorithms used, and a sensitivity analysis table to assess what would happen if more or fewer samples are collected than the optimal number calculated by VSP. The Room View provides a variety of ways for viewing the surfaces in a room, while the 3D View allows for viewing entire buildings or 3D areas.
Figure 1 . 1 . Screen Capture from VSP Using Quad Window Option ( Window > Quad Window )
The analytical value of lab results for samples can be input into VSP for Data Analysis including summary statistics of results, statistical tests applied to results for making decisions, and graphical displays of results. One of the designs, Sequential Sampling, requires intermediate results to be input to VSP so that VSP can determine whether further sample collection is required.
To defend a sampling plan to a regulator concerned about safety and to a citizens' group concerned about saving taxpayer dollars requires balancing cost and risk. Defensible means that sufficient samples are taken, in a non-biased way, in order to make a decision, estimate a proportion, or declare an area free of UXO/contamination with a stated level of confidence. Additionally, once samples are taken and the results processed, someone needs to apply a statistical test to actually make a decision based on the data or calculate a confidence interval. VSP incorporates all this into the code it uses to calculate a sample size and sample locations. It asks the user to enter the assumptions, acceptable risk, and costs it needs for these calculations.
VSP follows the EPA-sanctioned planning approach for data collection and decision-making called the Data Quality Objectives (DQO) process. The DQO process achieves the user's limit on acceptable risk, at a minimum cost. See EPA (2000a) for an extended discussion of the DQO process. There are 7 steps in the DQO process. Users must complete Steps 1 through 6 in order to have the inputs VSP needs. Then, using VSP, the user can complete Step 7, "Optimize the Design for Obtaining Data," because VSP can be used to try out different sampling designs and find the optimal design for the current problem.
Users familiar with the DQO process know that often a single site may have multiple sampling goals and multiple Sample Areas, each requiring its own set of DQO inputs and hence different sample requirements. VSP can help because it allows rapid prototyping and has many features that allow the overlay of designs and comparisons across designs.
For detailed documentation of how to use VSP as a defensible sampling plan, please refer to the VSP Help Topic How do i use VSP to Provide a Defensible Sampling Plan.