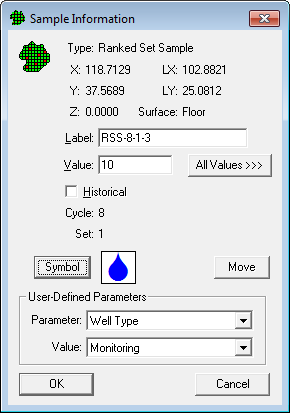
The Sample information dialog box displays information about a sample location including the Local Coordinates (LX, LY). It also allows certain built-in parameters as well as all user-defined parameters to be changed.
The dialog is accessed by right-clicking on a sample location on the map.
The dialog contains the following controls (not all controls may be visible or active for any given sample):
X |
View the X coordinate of the sample location. |
Y |
View the Y coordinate of the sample location. |
Z |
View the Z coordinate of the sample location. |
LX |
View the local X coordinate of the sample location (distance from local origin). |
LY |
View the local YX coordinate of the sample location (distance from local origin). |
Label |
Edit the sample label / name. |
Cycle |
For Ranked Set Samples , show the sampling cycle for the location. |
Set |
For Ranked Set Samples, show the sampling rank for the location. |
Press this button to change the symbol, size, or color used for this particular sample only. Launches the Sample Symbol Dialog for Individual Samples. |
|
For Random or Manual samples, move the sample to a new location. |
|
Edit the values of the user defined parameters for this sample location. |
Non-Collaborative design samples also contain the following controls:
Edit the primary sample value (which is the first data value for the first analyte). |
|
All Values |
Click this button to see and edit all the values for all the analytes as well as add more values (see Full Dialog below). |
Set whether sample is a historical sample. |
Collaborative design samples also contain the following controls:
Edit the measured value using the inexpensive measurement (and less precise) method. |
|
Edit the measured value using the expensive measurement (and more precise) method. |
|
Set whether both measurement methods are used for this sample location. |
Clicking the All Values button expands the dialog to reveal a grid that allows all the data values for all the analytes to be edited.
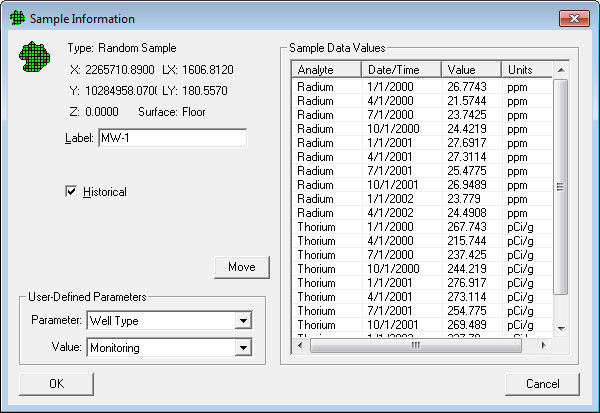
The grid allows you edit the Analyte (if more than one Analyte - see Analyte page), the Date/Time (optional) and the Value of a datum. New data can be added by entering information into a blank row at the bottom of the grid. Data are automatically sorted into Analyte, Date/Time order.
When working with samples created for the Establish a Boundary of Contamination design using an Enclosing boundary or a Partial boundary, this dialog box look like:
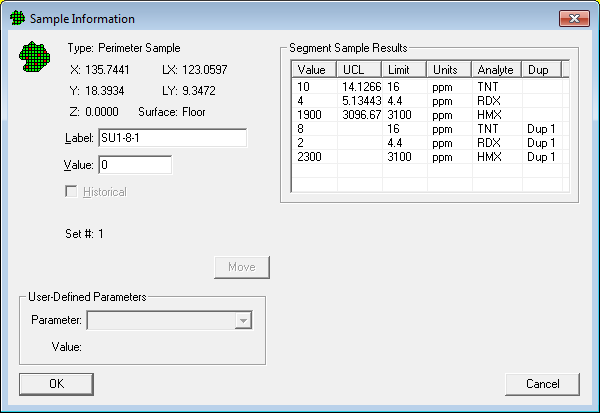
The grid on the right allows you to enter values for one segment of data. Segments marked as duplicates allow you to enter two values for each contaminant. If any of the values exceeds its limit, then a bump-out of the segment will occur once the OK button is clicked. Once all the data for duplicate segments has been entered, the upper confidence limit (UCL) for each value is also displayed. If any UCL exceeds the limit, a bump-out occurs. For duplicate segments, the UCL is computed on the mean of the two measurements for each contaminant in a segment. See the appropriate design for more information.